Khalifa Port, UAE: The slow flow of land reclamation
Khalifa port under construction
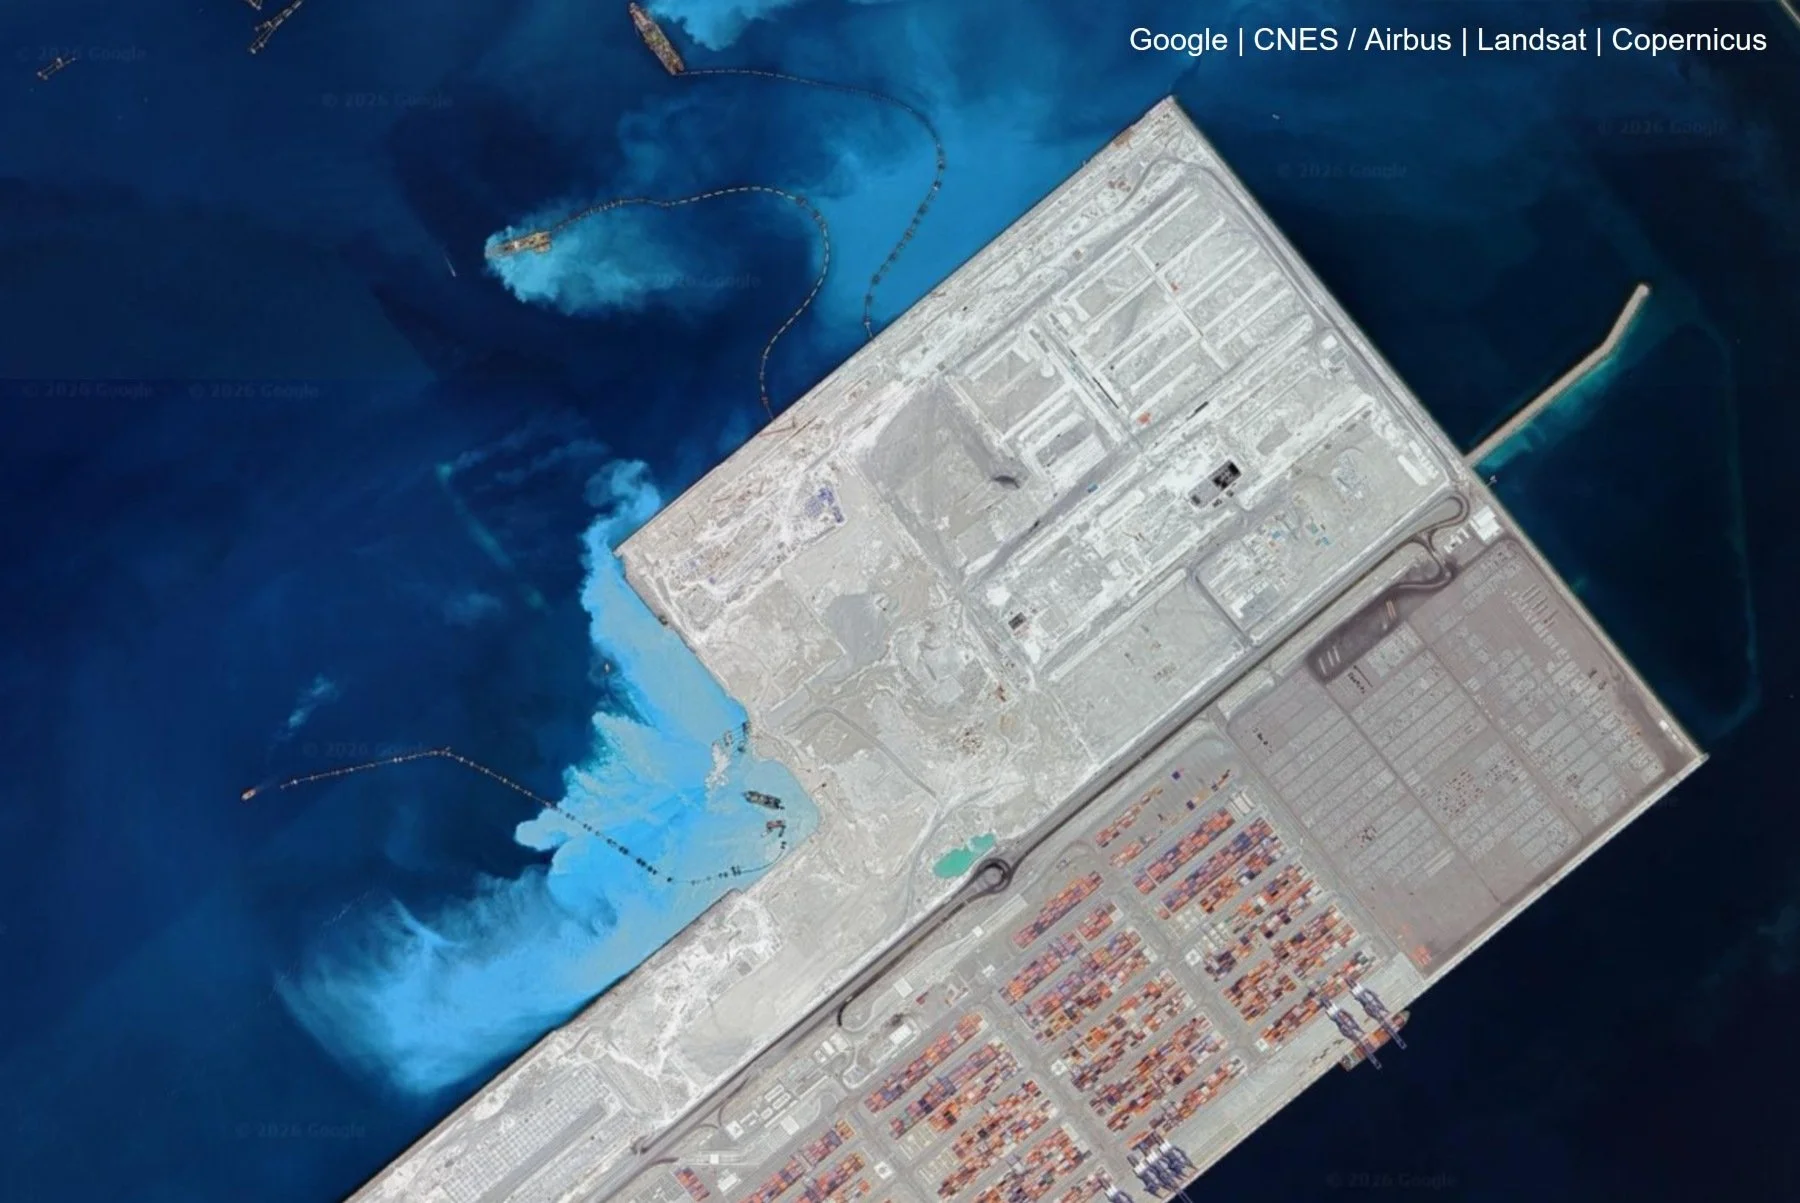
The image above caught my attention in Google Earth when studying anchorages for the Port Congestion Index: Stunning bloom of turbidity around the Khalifa port in Abu Dhabi.
Orbital Vantage has looked at port locations and their expansion in the past, so the image was easy to identify as dredging and land reclamation at play.
Today, we look at how this flagship container port has been reclaimed from the ocean floor over the last decade, and discuss why this project is virtually impossible to measure over short term from orbit.
1. What we see
The unnaturally rectangular island is a dead giveaway of human engineering. As are the vessels in the image sitting in the middle of the turbidity. They are at work expanding the port.
This is not construction in the traditional sense but a slow, controlled man-made sediment depositing. Still, figuring out exactly what is going on in the image below took a surprisingly long time as I have never really studied this process. We’ll analyse it through marked areas of A,B,C,D.
Key activity components marked for analysis
A. Dredgers feeding the slurry
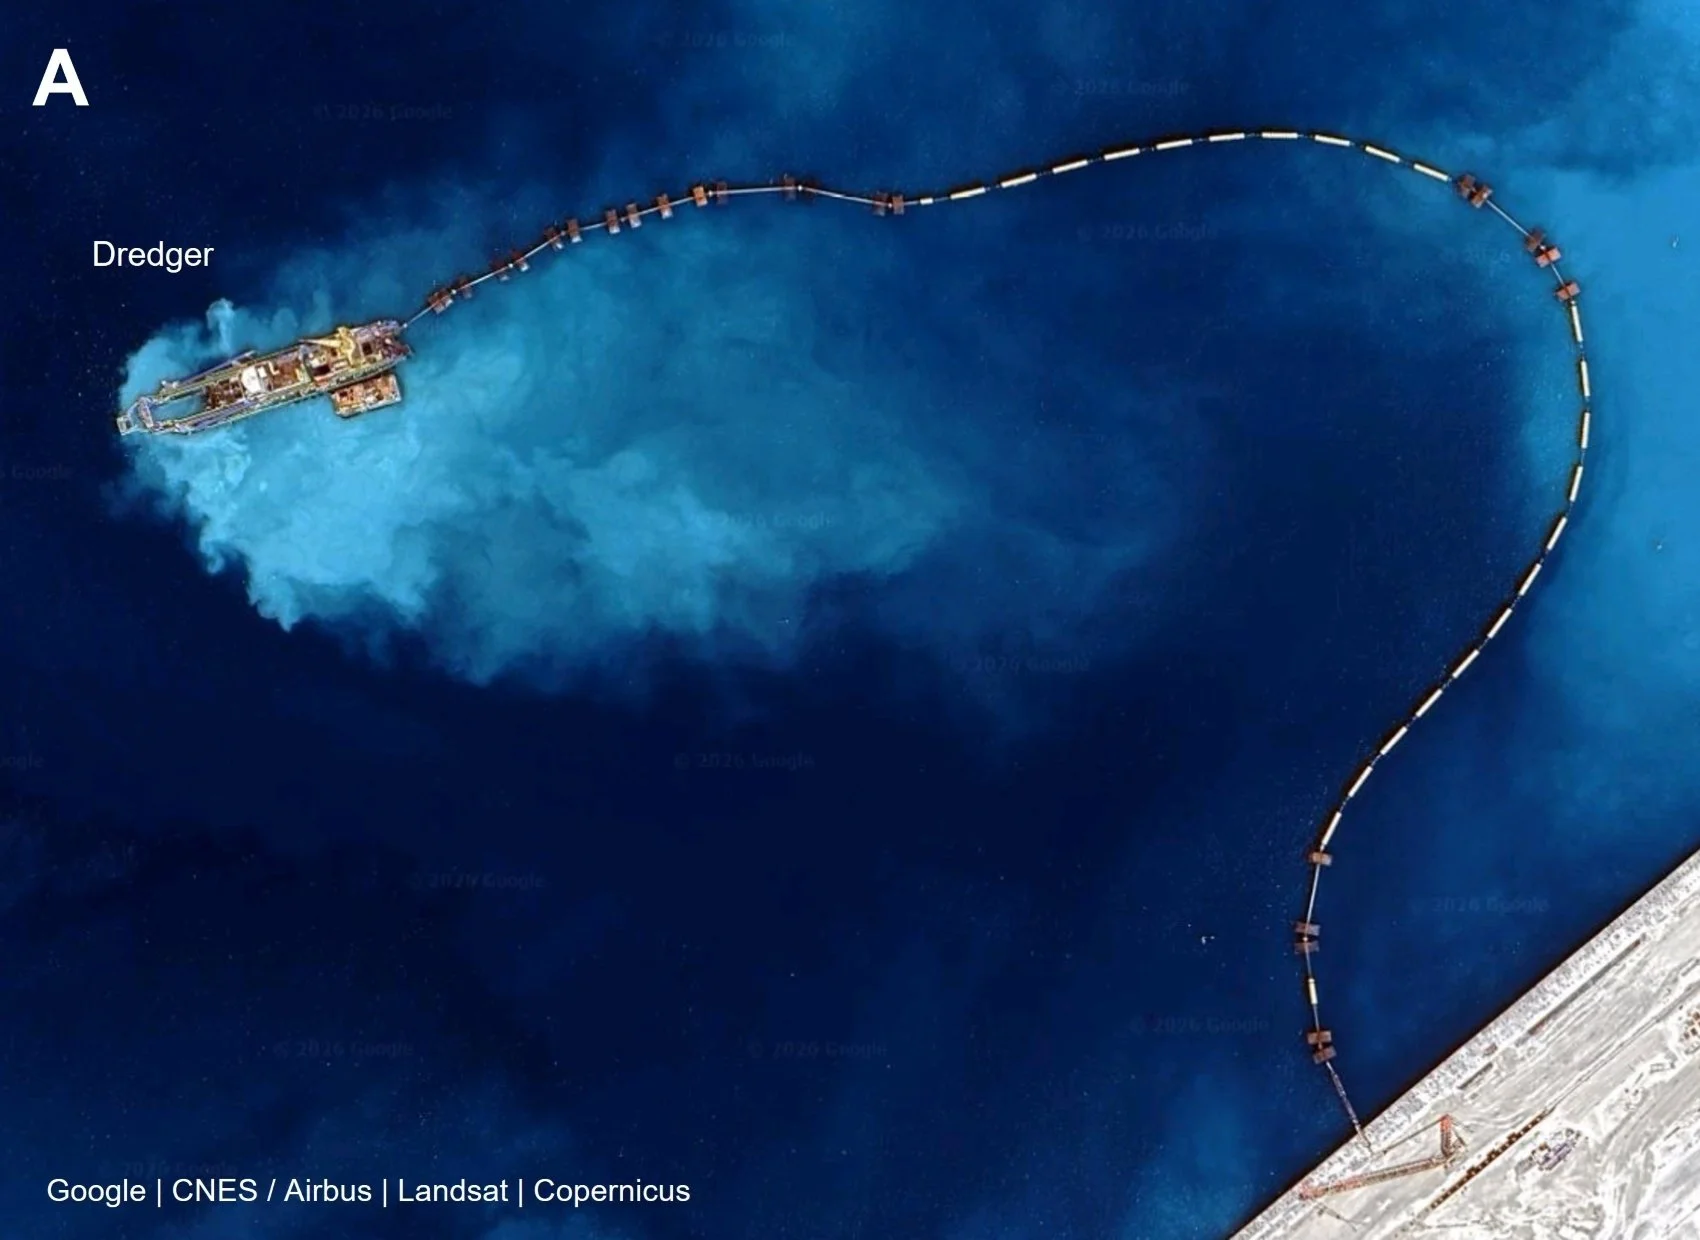
The dredger at work, pumping slurry via the pipeline connecting to shore..
These two ships are 100-140m long and dredge the floor for sand. This dredging is already causing turbidity around the ships.
The long dark tubes trailing from the ships, lined with floats, are discharge pipelines. These pipes carry a slurry of sand and water dredged from the seabed and pump it onto the reclamation site.
The pipes connect to the shore, but the lack of turbidity near the connection means the flow continues further onshore.
B. Piping to connect to the reclamation area
On closer inspection, the pipes continue on land and are discharged around the centre of the already reclaimed land.
The water is hard to see as it is as grey as the ground, but there is a clear white foamy outflow and excavators working to diffuse sediment buildup. This serves to keep filling this area, and the slurry also flows further on.
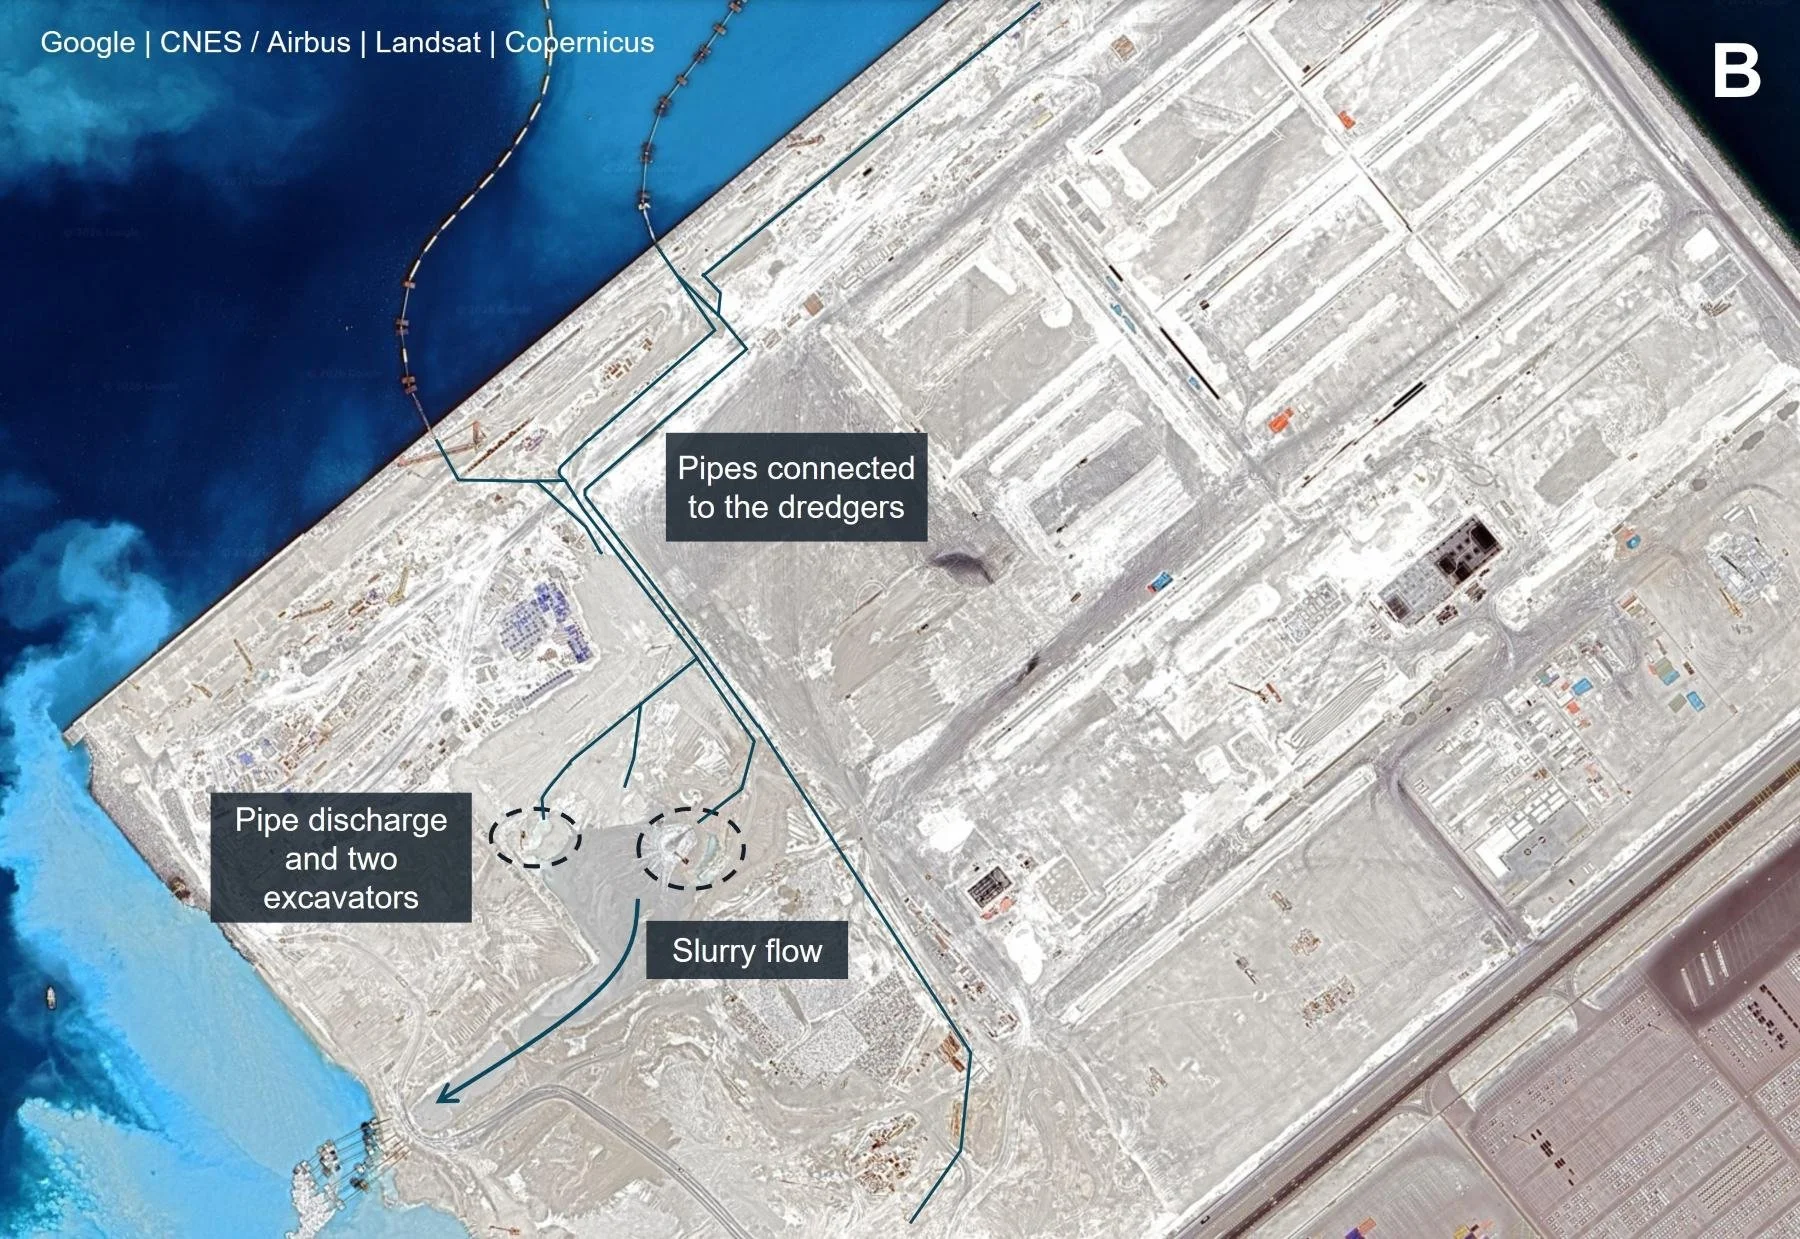
Highlighting some of the key piping visible on the surface, transporting slurry to the reclamation areas.
C. Main discharge area
The slurry flows all the way here to the expanding edge. Six pipes are visible discharging the slurry. As the mixture spreads, the heavier sand settles while the water escapes back into the sea, creating the milky turbidity plume visible from space. The blue colouring appears somewhat more intense than it would to naked eye due to Google’s image processing, but even in reality the colour can be quite striking.
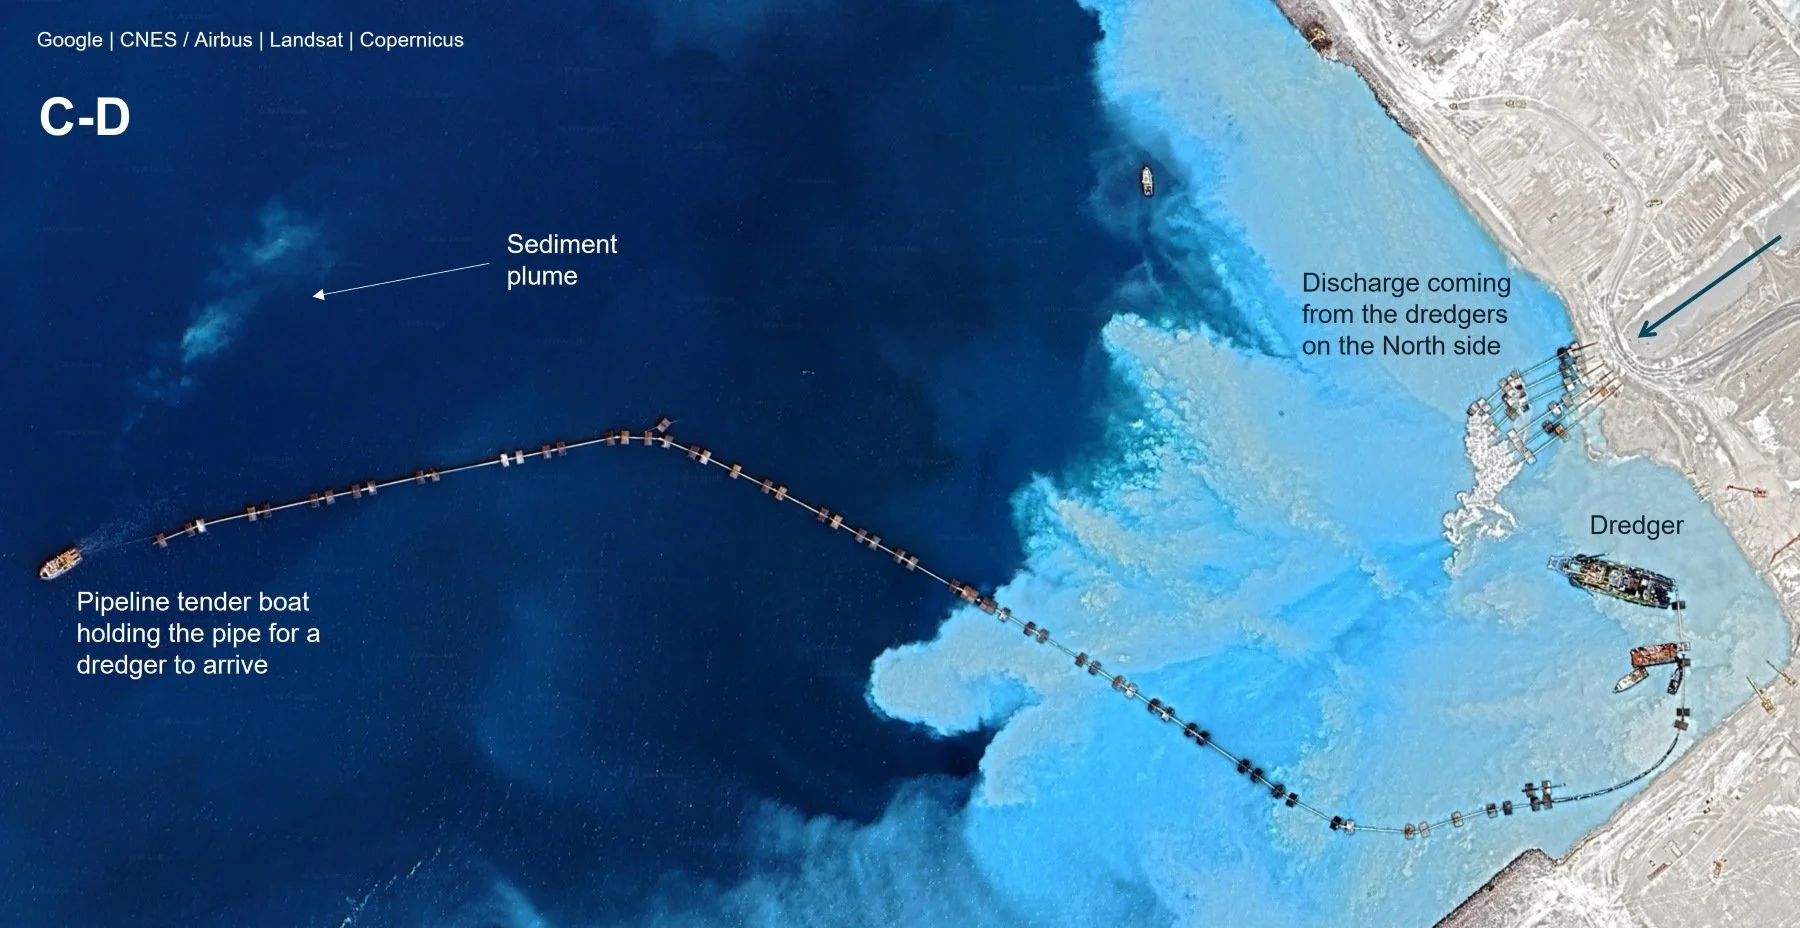
One of the larger dredgers is near this discharge. Its role I’m the least sure of. It could be redirecting the sediment flows or otherwise preparing the seafloor. There is a clear flow from it towards the “corner” nonetheless - whether intentional or incidental propwash, I don’t know.
D. Dredger placeholder
Finally, there is a smaller ~30m vessel on the left side of the above image, that is a tender boat holding the pipe and waiting for a dredger to connect to it. It is causing a small wake, so it is either moving the pipe or using propulsion to counter current and/or wind. The sediment plume is a bit of a question mark, but could be propwash induced or propwash-redirected errant wisp.
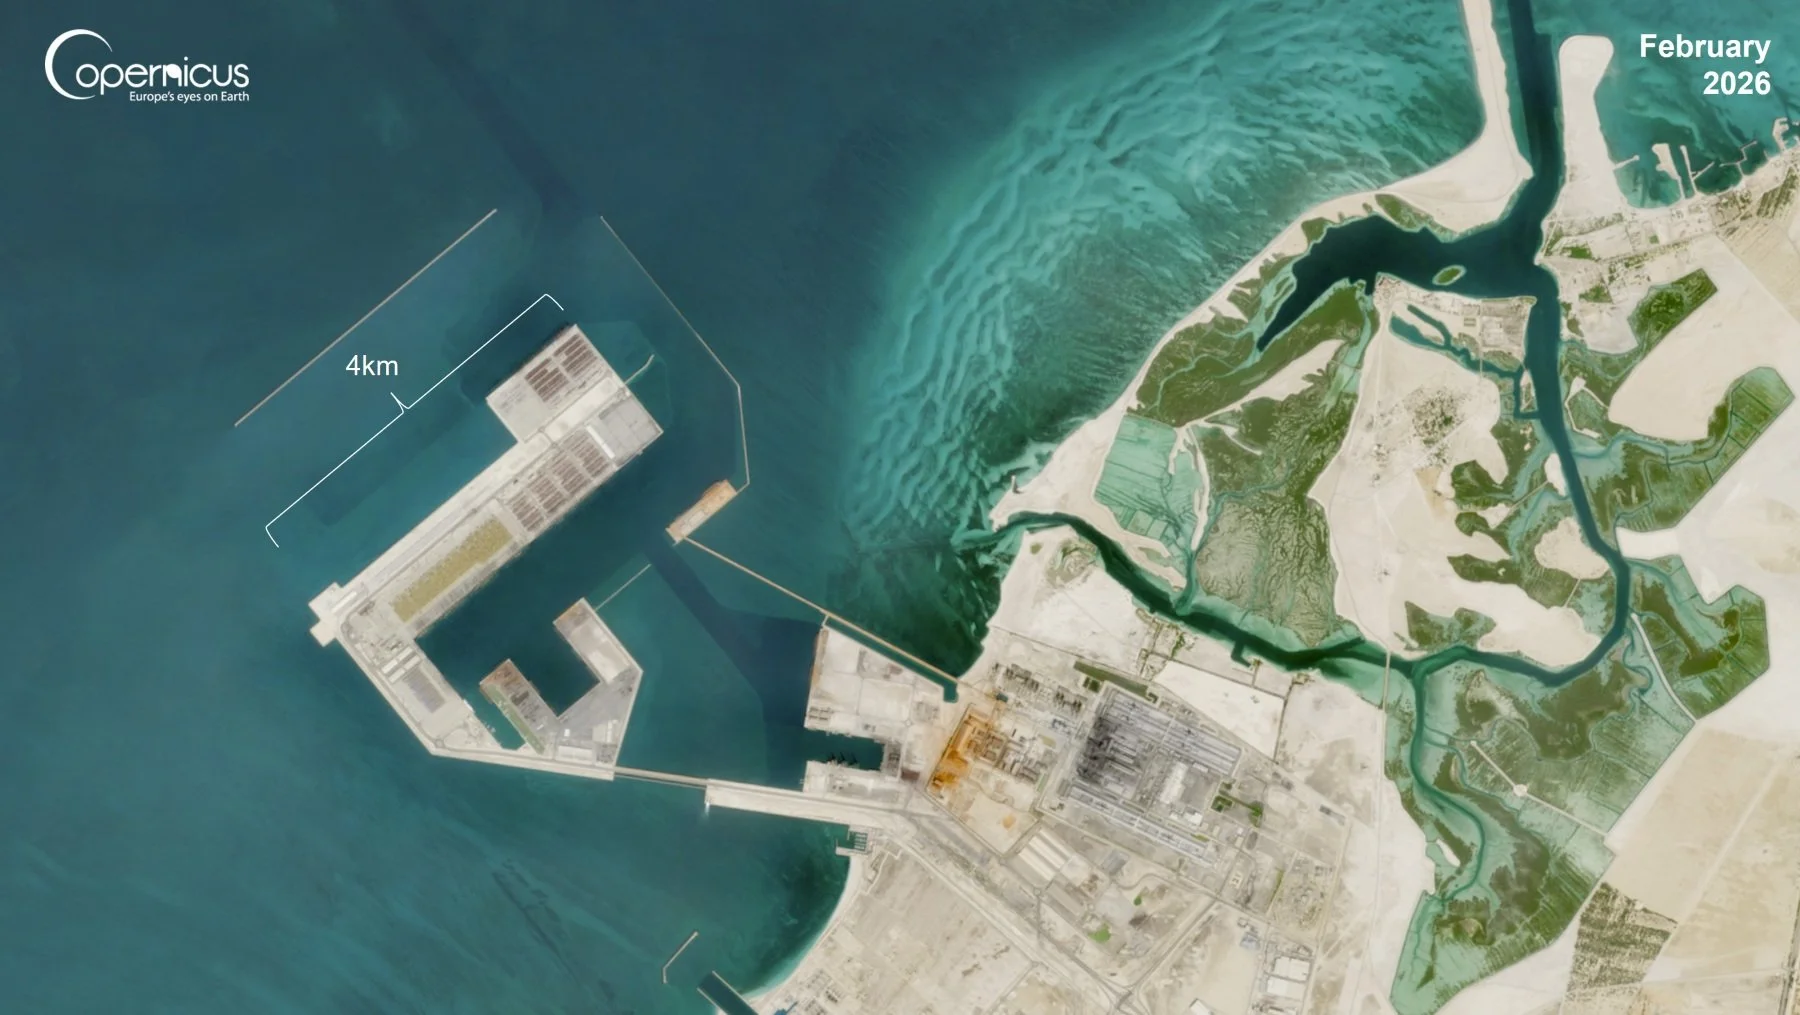
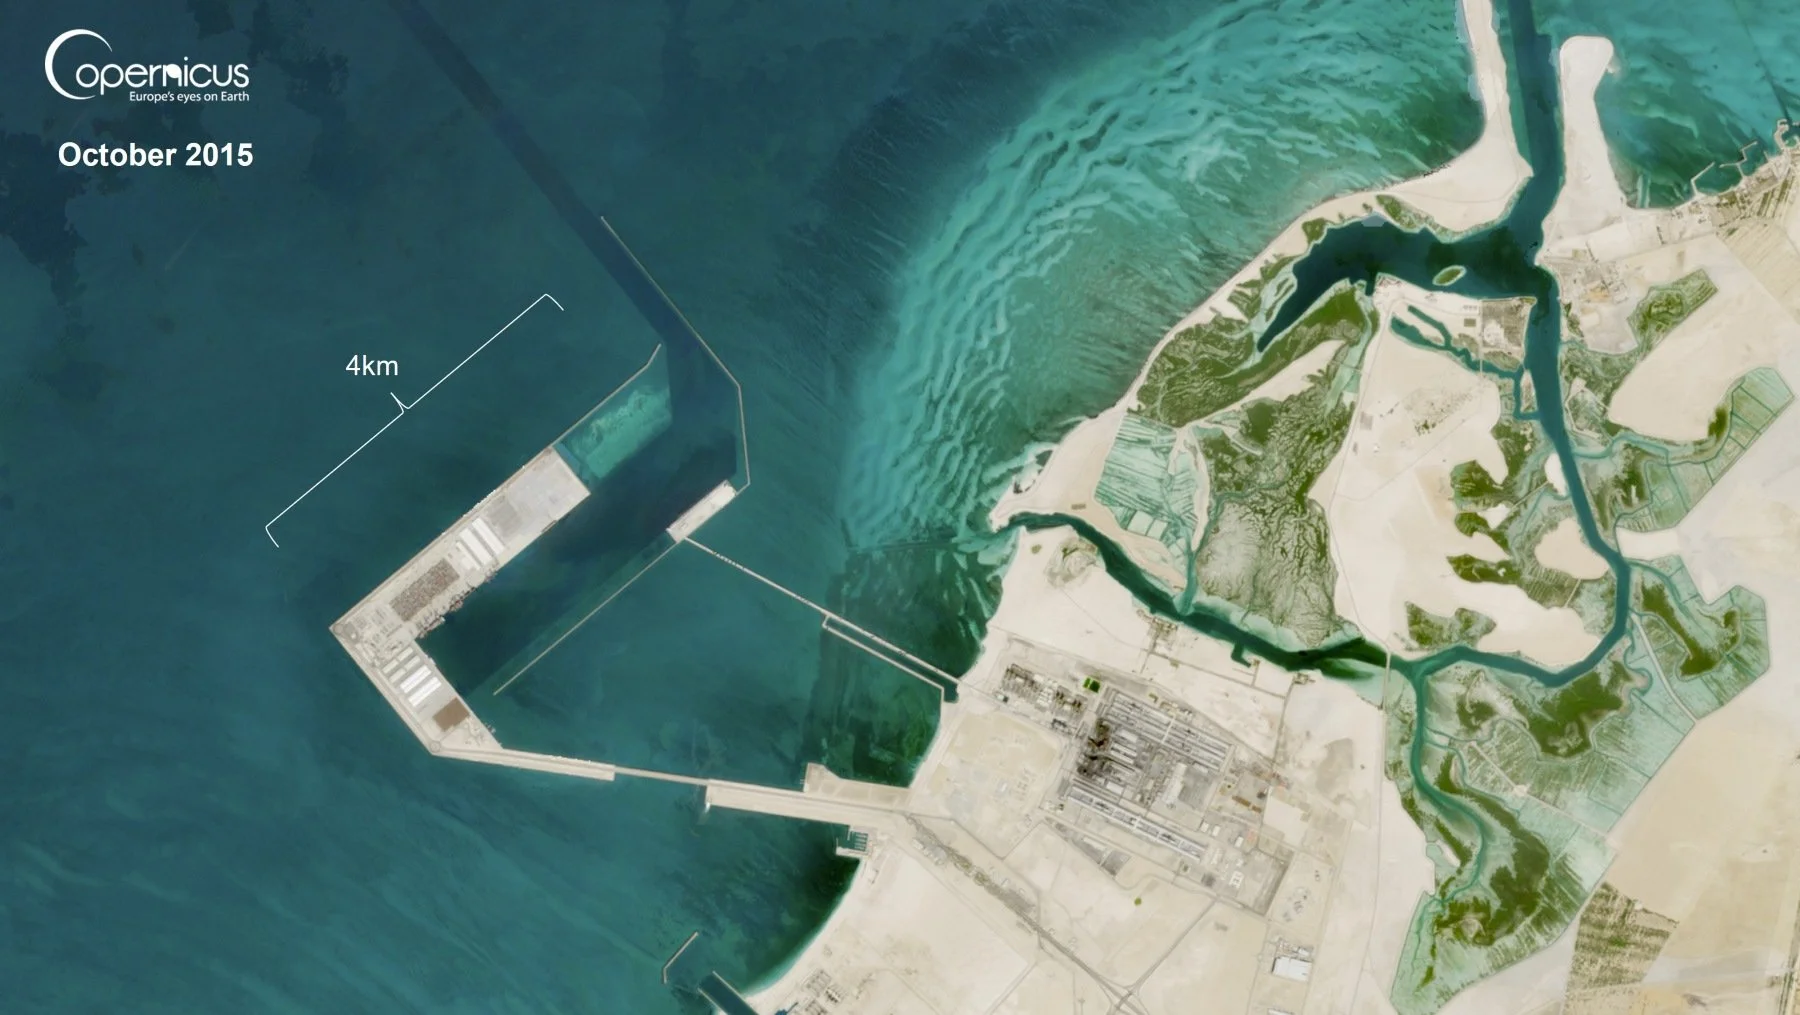
2. Tracking the reclamation over time: Before and after
When we tracked the building of the Hornsea wind farm, once every two months tracking was almost too sparse. Here, we could almost resort to one image every two years as land reclamation is a slow business.
But stretch the timeline to a decade and the result is unmistakable: A new terminal emerging into the Gulf. Use the image slider below to see the difference between 2015 and 2026. No fancy automated image analysis or area measurement in Google Earth Engine is necessary this time to detect change.
3. Why so slow?
The process itself runs close to 24/7 when underway to make highest use of the costly fixed equipment, but the progress is constrained by physics.
The sea floor needs to be prepared for the fill. Then the filling material must be dredged, transported, and placed. The fill in turn needs to settle and stabilise and only a limited number of ships can operate safely in parallel. So while the operation is constant, the visible change over months is incremental and largely below the surface.
Appreciation for the scale is best understood by calculating the volume of sand required.:
First, the main terminal area is 7km2.
The overall height from dredged bottom to terminal floor surface can be 30 metres or so
The ballpark volume to fill is over 200 million cubic metres (and every cubic metre weighs ~1700kg)
While in this case the sand is locally dredged and deposited, we can convert the volume into shiploads: If we assume an average bulk carrier that takes 60,000m3 of sand, it would take well over 3,000 full shiploads of sand to create the port. For the 2-3 ships doing the sand dredging and pumping, this means a lot of coffee and patience.
Conclusion: Why this matters
Some of the largest infrastructure projects on Earth do not look dynamic or dramatic from orbit, despite being a 24/7 hive of activity. For land reclamation, monitoring real-time progress month-by-month from orbit is in practice impossible because the layered work mostly takes place under the surface. But as a constant evolution of a coastline, low-key satellite monitoring works fine and in the process reveals captivating imagery and details about the process itself.
See you,
Orbital Vantage