Lüderitz, Namibia: The place for windsurfing speed records
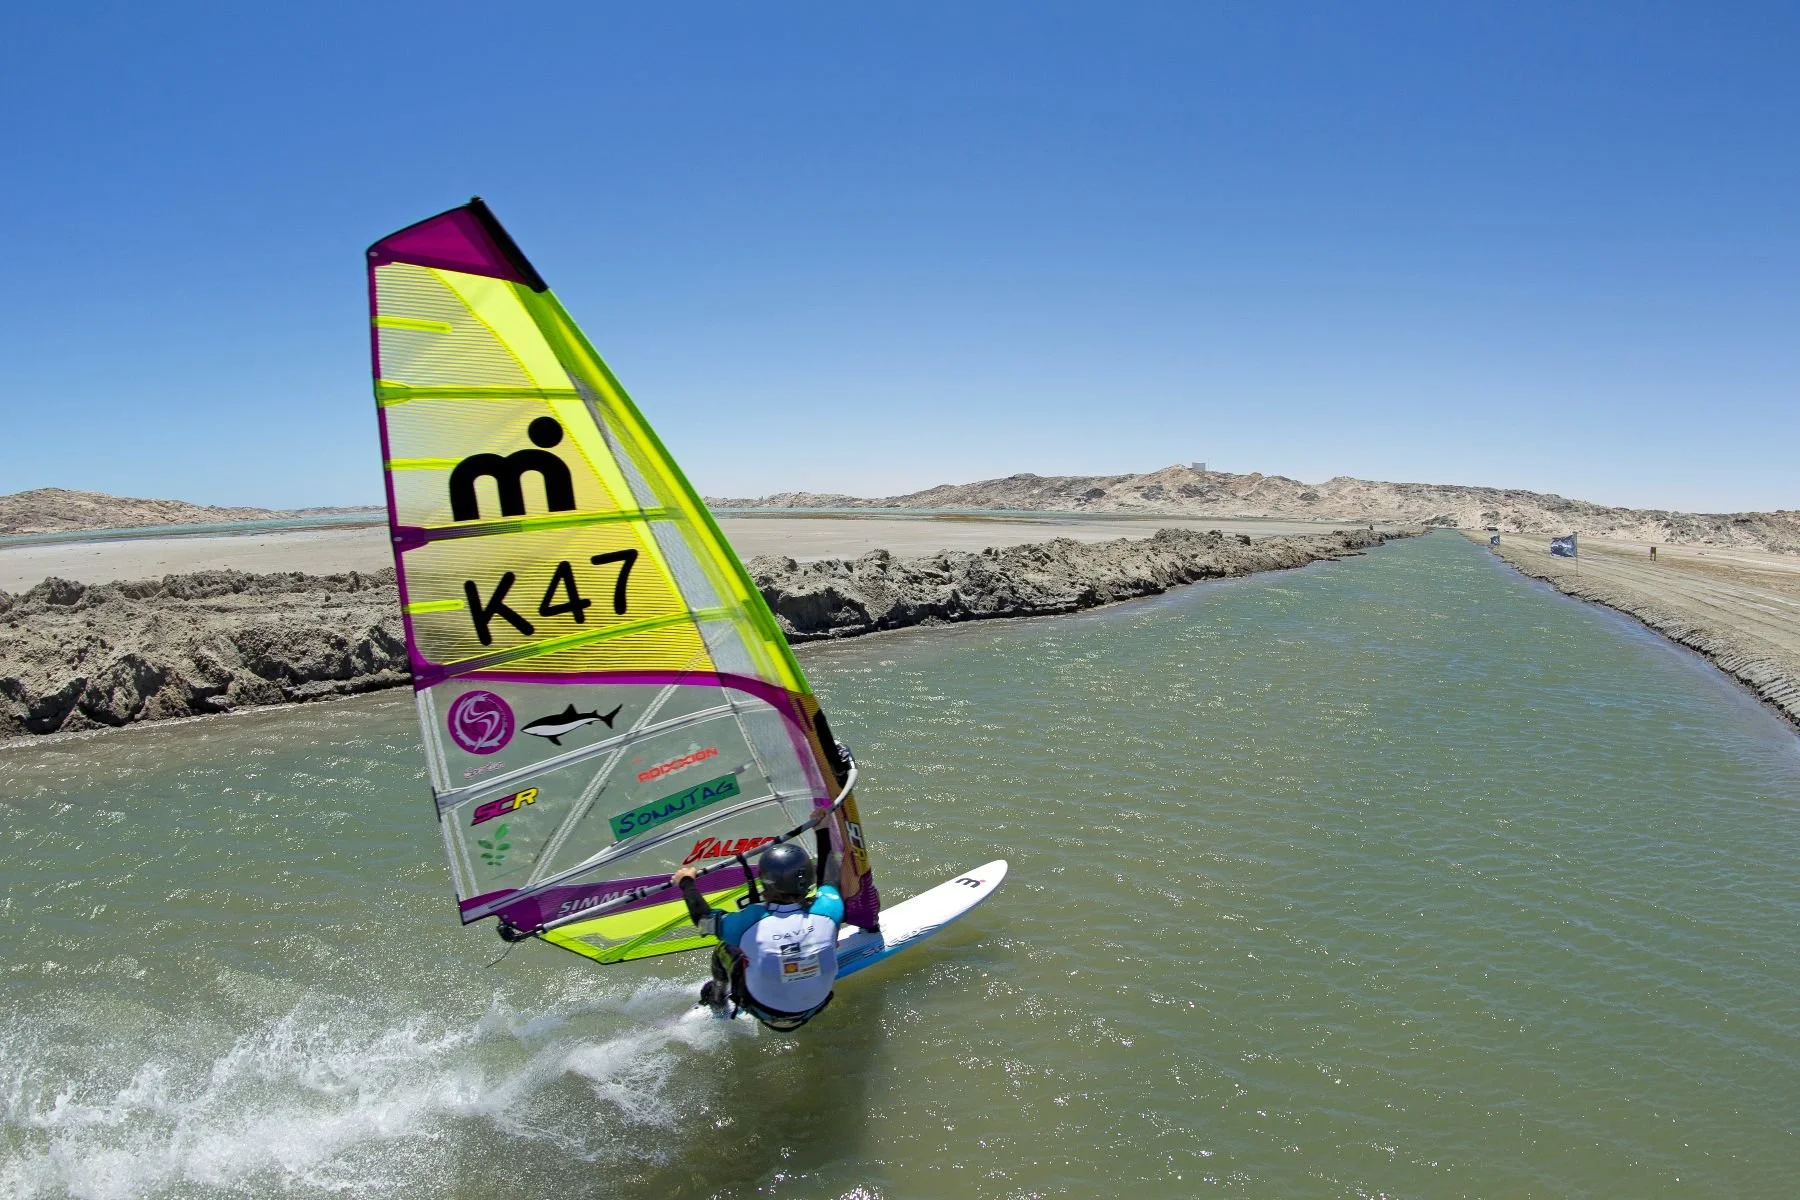
Zara Davis blasting down the Lüderitz canal. Photo by Walnut1340 under CC BY-SA 3.0.
This post is part of our “Wind series”, where we explain the formation of strong or otherwise peculiar winds.
I love windsurfing. The initial learning curve is punishing but it quickly gets easy and the feeling of planing while hanging from the harness and riding towards the open sea is something else entirely.
The speeds I’ve reached are nothing compared to the world record - 53.5 knots or 99km/h - reached at the Lüderitz Speed Challenge in Namibia by Antoine Albeau. This challenge is annually held around November.
Today, we explain why Lüderitz is the place for windsurfing speed records.
Standard wind analysis framework
We apply the Orbital Vantage wind analysis framework to anchor key variables.
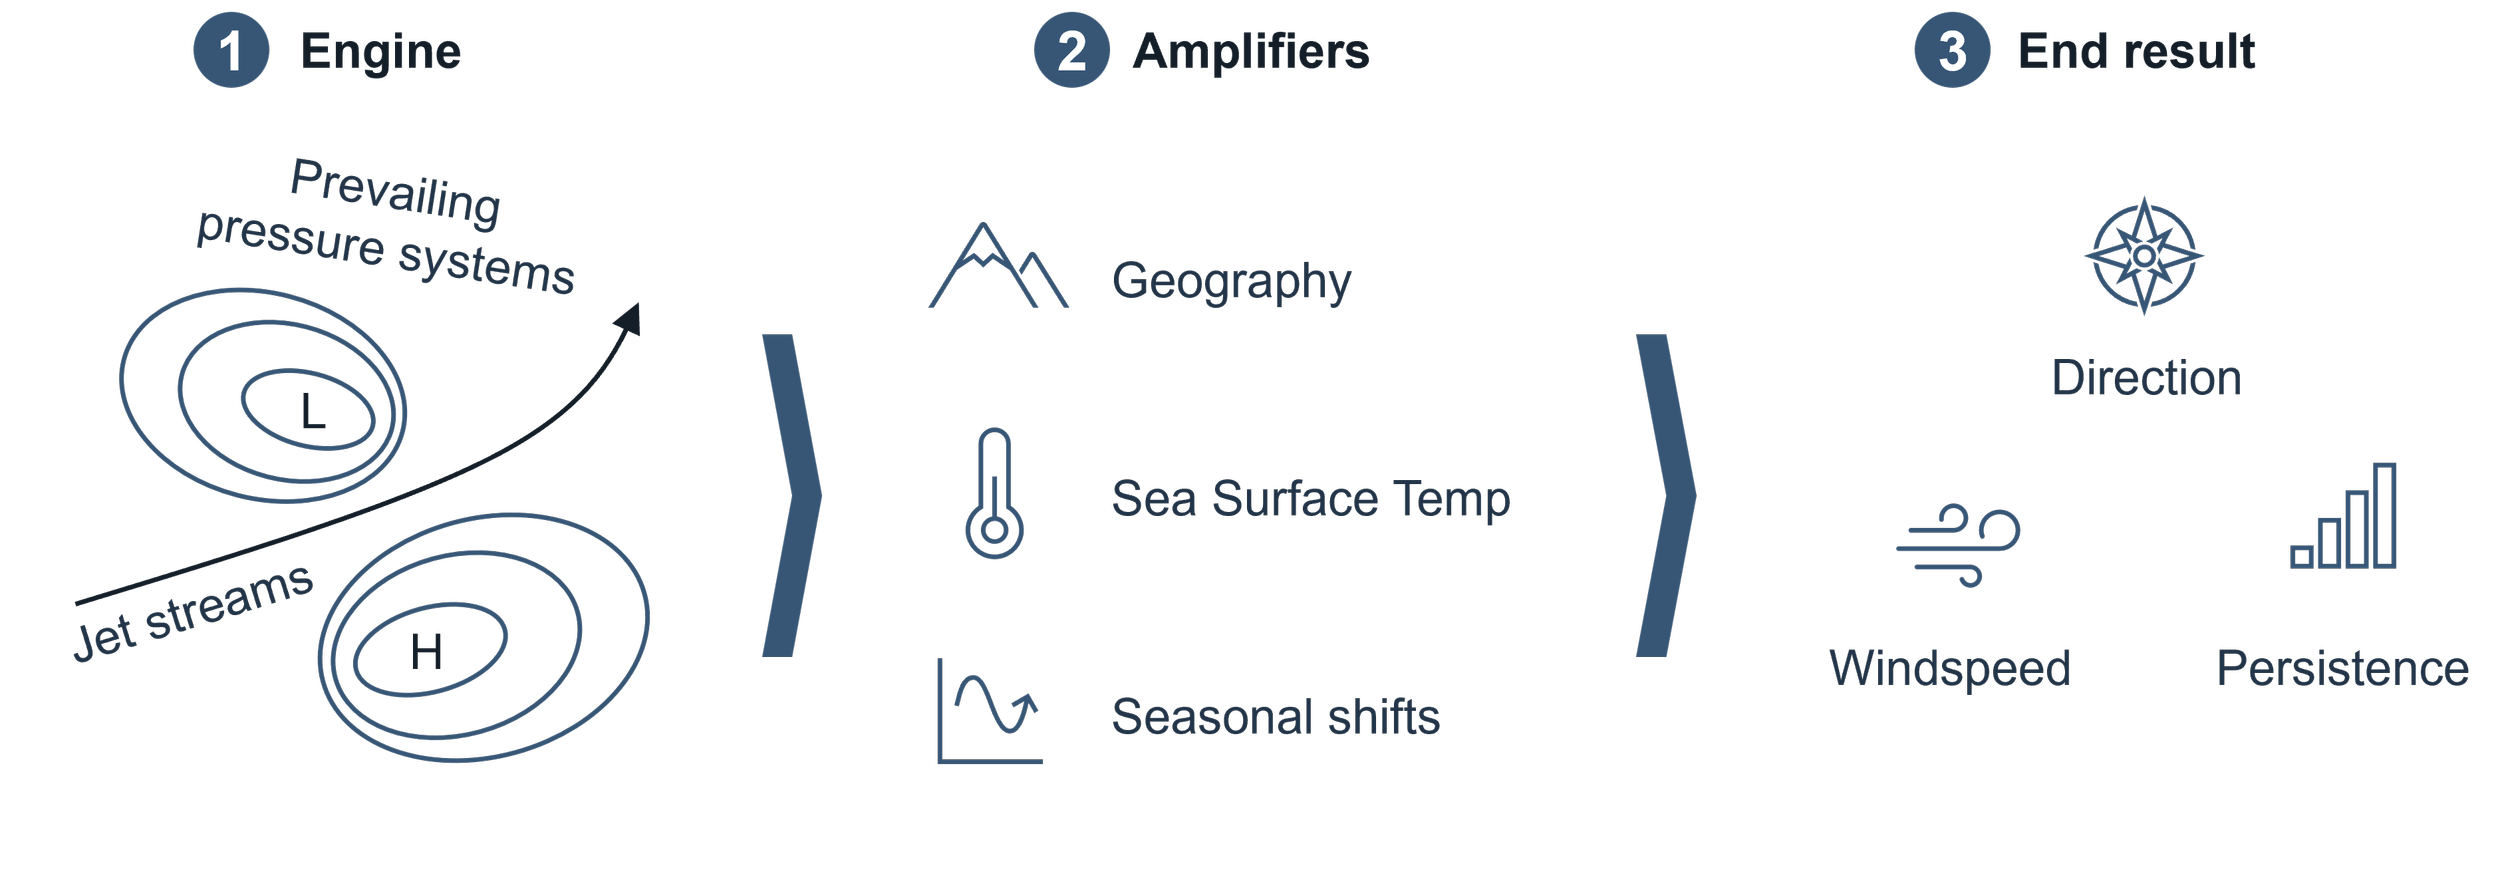
Orbital Vantage wind analysis framework
1. The engine
At a global level, Lüderitz sits under the influence of the South Atlantic high-pressure system, part of the subtropical belt. This system creates a persistent south-to-north wind flow along the southwest coast of Africa.
Two ingredients matter here visible in the pressure map below:
A stable high-pressure system offshore
A hot, low-pressure desert inland (the Namib Desert)
This pressure gradient pulls air northward along the coast as a reliable, daily engine. Unlike the more chaotic storm-driven winds we saw in New Zealand, this is an extremely reliable trade-wind regime.
2. Amplifiers
Geography
I’m starting to think there are no places in the world where geography wasn’t a key factor for strong winds.
In the big picture, the entire African continent shows as an elevated plateau on the elevation map below. The winds circling counter-clockwise over the Ocean are thus compressed on the coast. You can see that Lüderitz sits at a slight bump on the coast, with potential for even more compression.
Elevation profile of southern Africa with illustrated windflow on the Namibian coast.
On closer look, the coastline here is not smooth but jagged with peninsulas, bays, and shallow lagoons that naturally accelerate wind. The satellite image below shows that the speed challenge area sits exactly at the southern part of bay - a natural wind tunnel.
Lüderitz Speed Challenge location seen in October 2018 when the event was on. Event tents are just visible at the western end of the channel.
The shoreline angle is roughly 140 degrees for a southerly wind which is a critical piece of the puzzle. We won’t go into detail, but this angle is considered perfect for maximising windsurfing speed while maintaining stability. To make full use of this, the canal visible in the image was dug in 2008 for the second speed challenge event.
SST (Sea Surface Temperature)
The Benguela Current runs along this coast, bringing cold water from the south. See below this effect in the image in green, with cold upswelling in blue visible on the coast.
This is the first time I’ve had to think about SST as a true amplifier, but here it matters more than first appears. The cold ocean means cool air, cold air is stable, which leads to less turbulence and ultimately a cleaner, faster wind flow without as many gusts.
Seasonal variation
The Lüderitz Speed Challenge is held in November which hints at a seasonal factor. Below image comparison shows the sea level pressure difference between a typical year and a typical November..
Sea level pressure annual vs. November shows the tighter pressure gradient in November.
In the November data, we see a stronger high-pressure area on the southern Atlantic, and also a stronger low pressure over Africa due to inland heating in the desert. The tightest pressure gradient curve neatly intersects around Lüderitz. In plain terms, a stronger pressure gradient means more wind. See below wind speed data for a typical November.
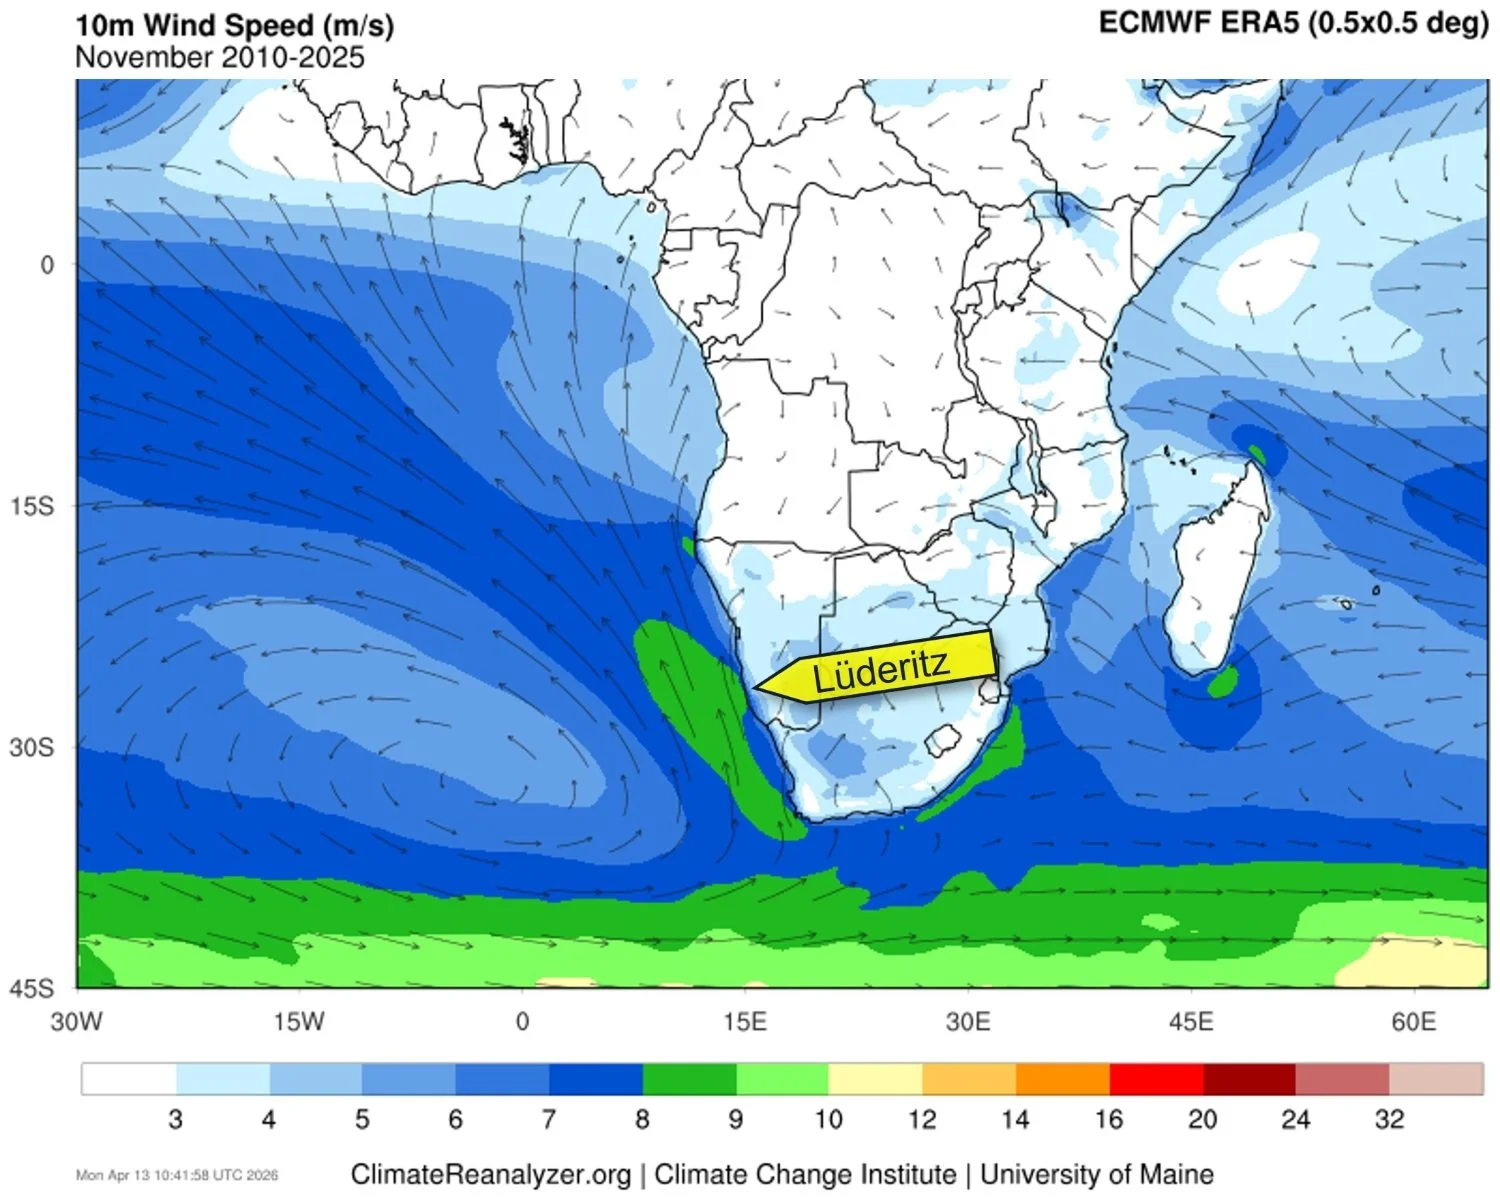
November data shows the accelerated winds on the Namibian coast.
3. The result
The combination of strong and reliable wind engine (South Atlantic high pressure), geographic channeling, seasonal intensification, and man-made channel that perfects the conditions is what makes Lüderitz the place for windsurfing world records.
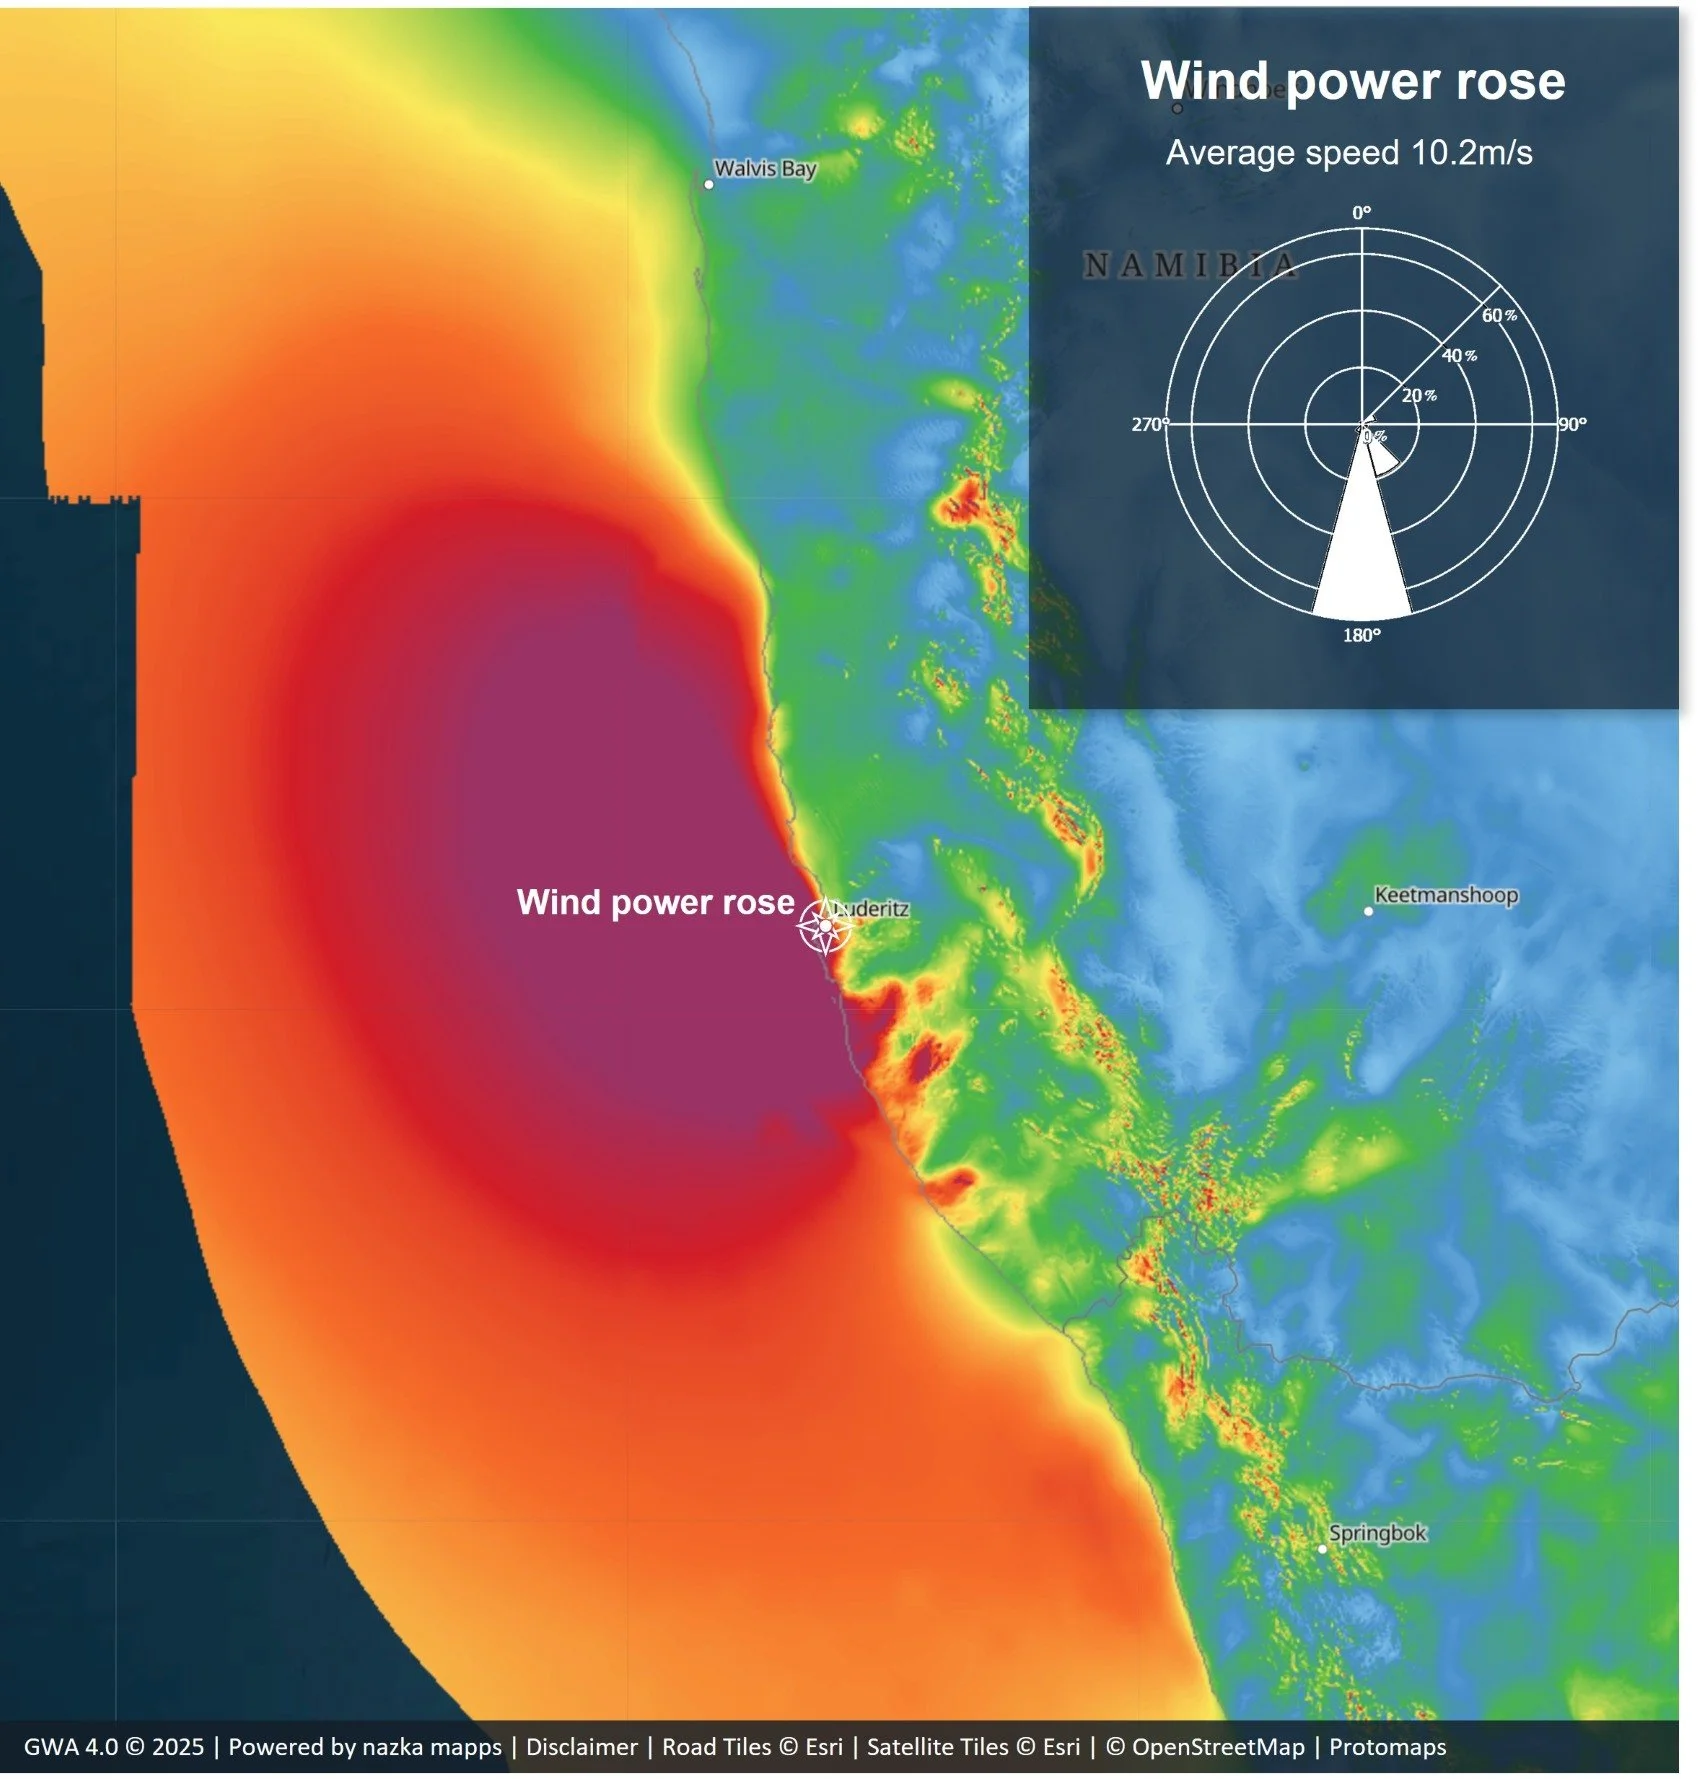
Wind power density map shows the high-intensity wind area around Luderitz, with annual average wind speed of 10.2m/s.
Even with this optimal setup, peak conditions happen with hot days over the desert intensifying the low-pressure gradient and/or stronger high pressure over the ocean. On those days, the already strong wind becomes stronger still reaching 20m/s or more.
Conclusion
Lüderitz is another great example of something we see from orbit: The location is not random and we can explain cleanly with data retrieved from orbit.
For an average windsurfer like me, Lüderitz would probably create a record of bones broken while windsurfing.
See you,
Orbital Vantage