Port Congestion Index
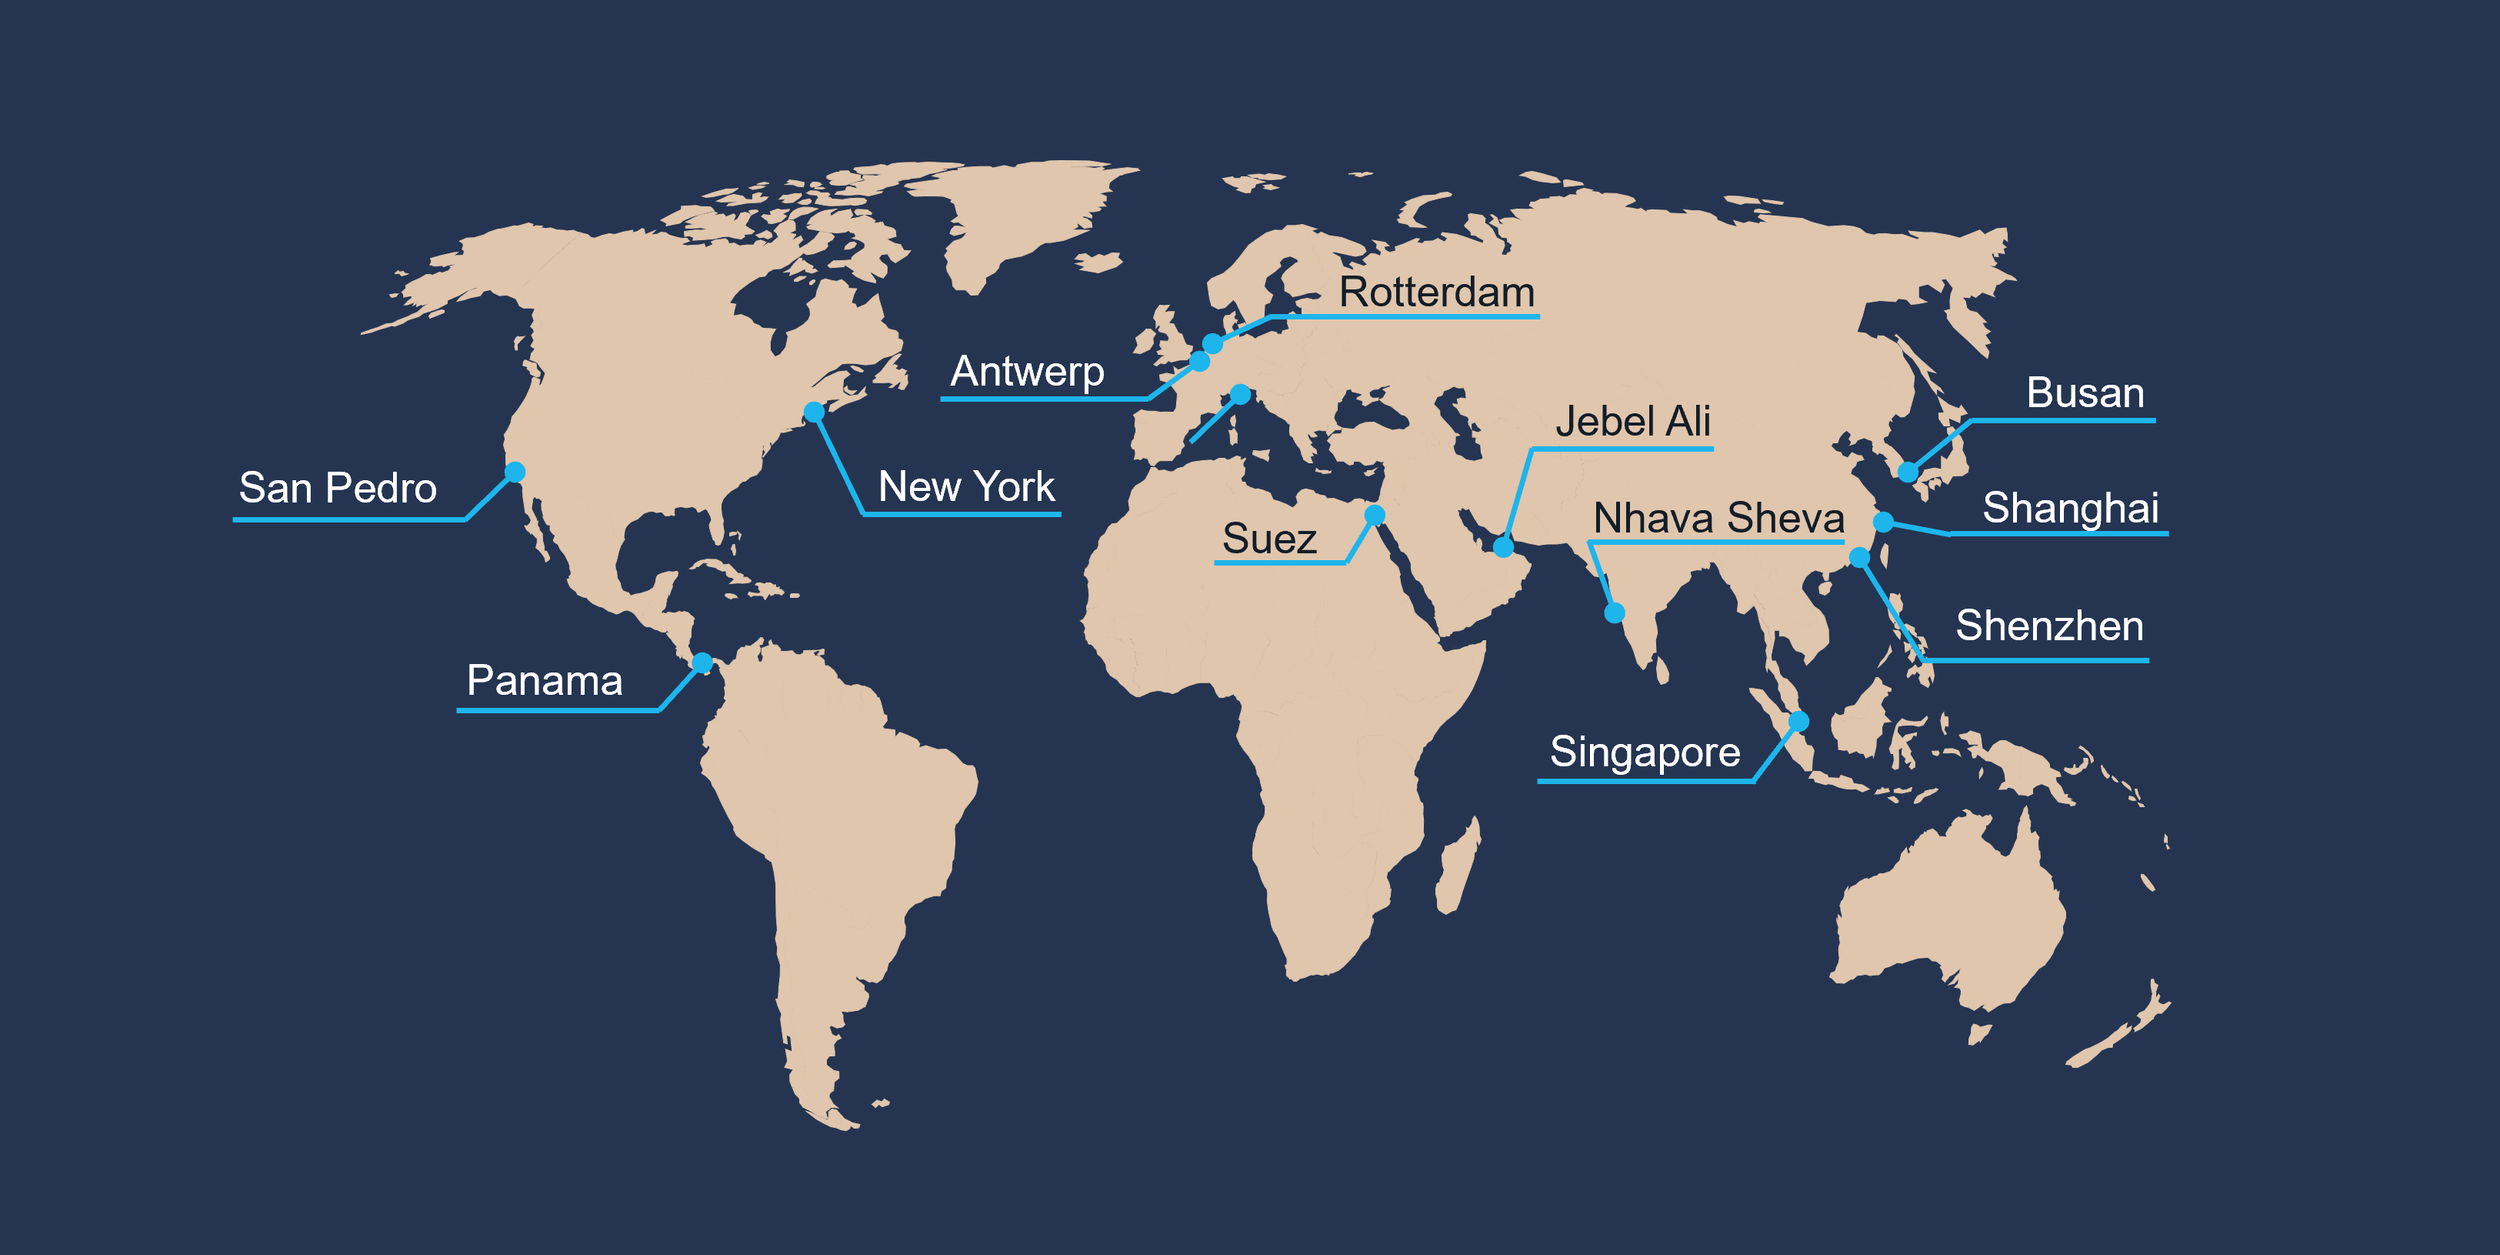
Coverage
The Port Congestion Index currently monitors 897km² across 12 global trade hubs and maritime choke points, with 28 defined anchorages.
Singapore -
Shanghai -
Shenzhen -
Busan -
Nhava Sheva -
Jebel Ali -
Rotterdam -
New York -
San Pedro (LA) -
Suez Canal -
Panama Canal -
Singapore - Shanghai - Shenzhen - Busan - Nhava Sheva - Jebel Ali - Rotterdam - New York - San Pedro (LA) - Suez Canal - Panama Canal -
Latest Weekly Index
The graph displays a weekly comparison of major global container ports using Sentinel-1 SAR-satellite observations of ships waiting at anchorage.
The weekly index is expressed as a Z-score relative to a 2025 baseline. Values near 0 indicate normal conditions, while higher values reflect increasingly elevated congestion. Values above 2 indicate major congestion.
Methodology v1.0 - Experimental release
*Tracks canal approach anchorages
Tracking index by port
The tracking Index displays congestion trends at major global container ports using Sentinel-1 SAR-satellite observations of ships waiting at anchorage.
The weekly index is expressed as a Z-score relative to a 2025 baseline. Values near 0 indicate normal conditions, while higher values reflect increasingly elevated congestion. Values above 2 indicate major congestion.
Methodology v1.0 - Experimental release
*Tracks canal approach anchorages
Monthly observation log
Standing notes
Rotterdam: As one of the most complex, mixed-anchorage ports in the dataset, the container congestion events show less muted peaks but are still visible in the data (e.g. February 2025 strikes, Summer 2025, October 2025 strikes)
April 2026
Key observations
Panama Canal Pacific side: Major uptick in the index indicating building queues, reported in the media as associated with Iran war -caused disruptions
March 2026
Key observations
Antwerpen: Reported labour strike on March 12th causes severe congestion, seen in the index shooting quickly up (daily Z-scores at 2, but overall weekly score staying at 1.24)
Jebel Ali: Iran war and resulting closure of Strait of Hormuz prevent inbound traffic, seen as low activity in the index
New York: Index showed a briefly returning congestion, though possible cause is clear. The mixed anchorage may have container ships, bulk carriers and tankers present that may distort the view
Nhava Sheva: Port Congestion index has shot up towards the end of the month with largest anchorage count recorded in the index so far. Whether this is true congestion or vessels waiting for routing due to global disruptions is unclear from the index alone
Suez Med: Slight uptick in the index. The expectation is that tankers headed for Persian Gulf have suspended Suez transit for now, possibly increasing number of vessels in the anchorage
Suez Red Sea: Index clearly above baseline indicating increased vessel build-up
Other comments
The war in Iran starting February 28th led to closure of the Strait of Hormuz. This and wider instability in the region are expected to bring immediate impacts to Jebel Ali. Other tracked ports may be impacted with time lag
February 2026
Key observations
Jebel Ali: Severe congestion in early February due to thick fog disrupting operations
New York / New Jersey: Winter storm Hernando caused notable disruptions
Rotterdam: Continued with notably less congestion than overall in 2025
Busan: Congestion peak that eased towards the end of the month. Reports indicate vessel bunching and lunar New Year break
Other comments
The war in Iran starting February 28th led to closure of the Strait of Hormuz. This and wider instability in the region are expected to bring immediate impacts to Jebel Ali. Other tracked ports may be impacted with time lag