Explaining Earth from orbit
Satellite data is becoming one of the most powerful tools for understanding our planet - from natural phenomena to to global trade. Here, you can see it in action one phenomenon at a time.
About Orbital Vantage
In early 2026, I wanted to run safely on Baltic Sea ice and looked to satellite imagery for help. That small experiment quickly expanded into a broader curiosity about what Earth observation satellites can reveal from storms and desert winds to ports, cities, coal mines and global trade.
Most posts start the same way: A satellite image that raised a question, and a stubborn attempt to answer it from first principles before consulting Google or anyone who actually knows. Satellite imagery, basic physics, and general curiosity get you surprisingly far. When they don't, I say so. Orbital Vantage is less about definitive answers and more about what careful observation alone can reveal.
This site documents those explorations, and the tools that occasionally grow out of them.
Two ways to explore Orbital Vantage
Insights
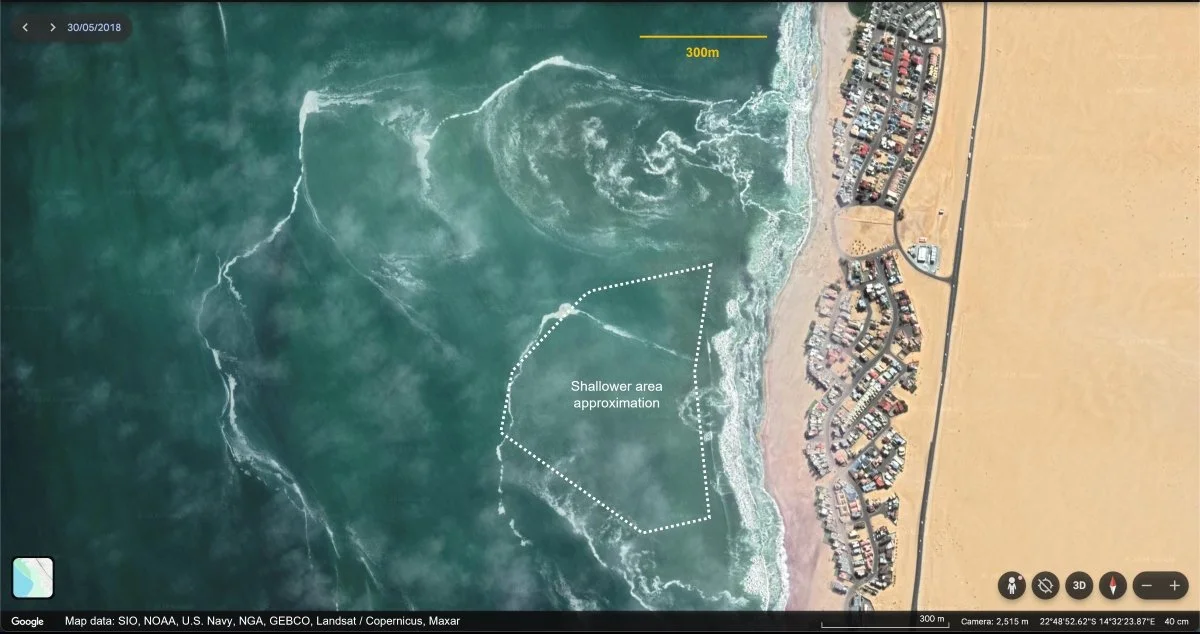
Exploratory satellite analysis
We experiment with satellite data, investigate real -world phenomena and test new analytical ideas. Most remain simple explorations, others evolve into operational monitoring projects
Port Congestion Index
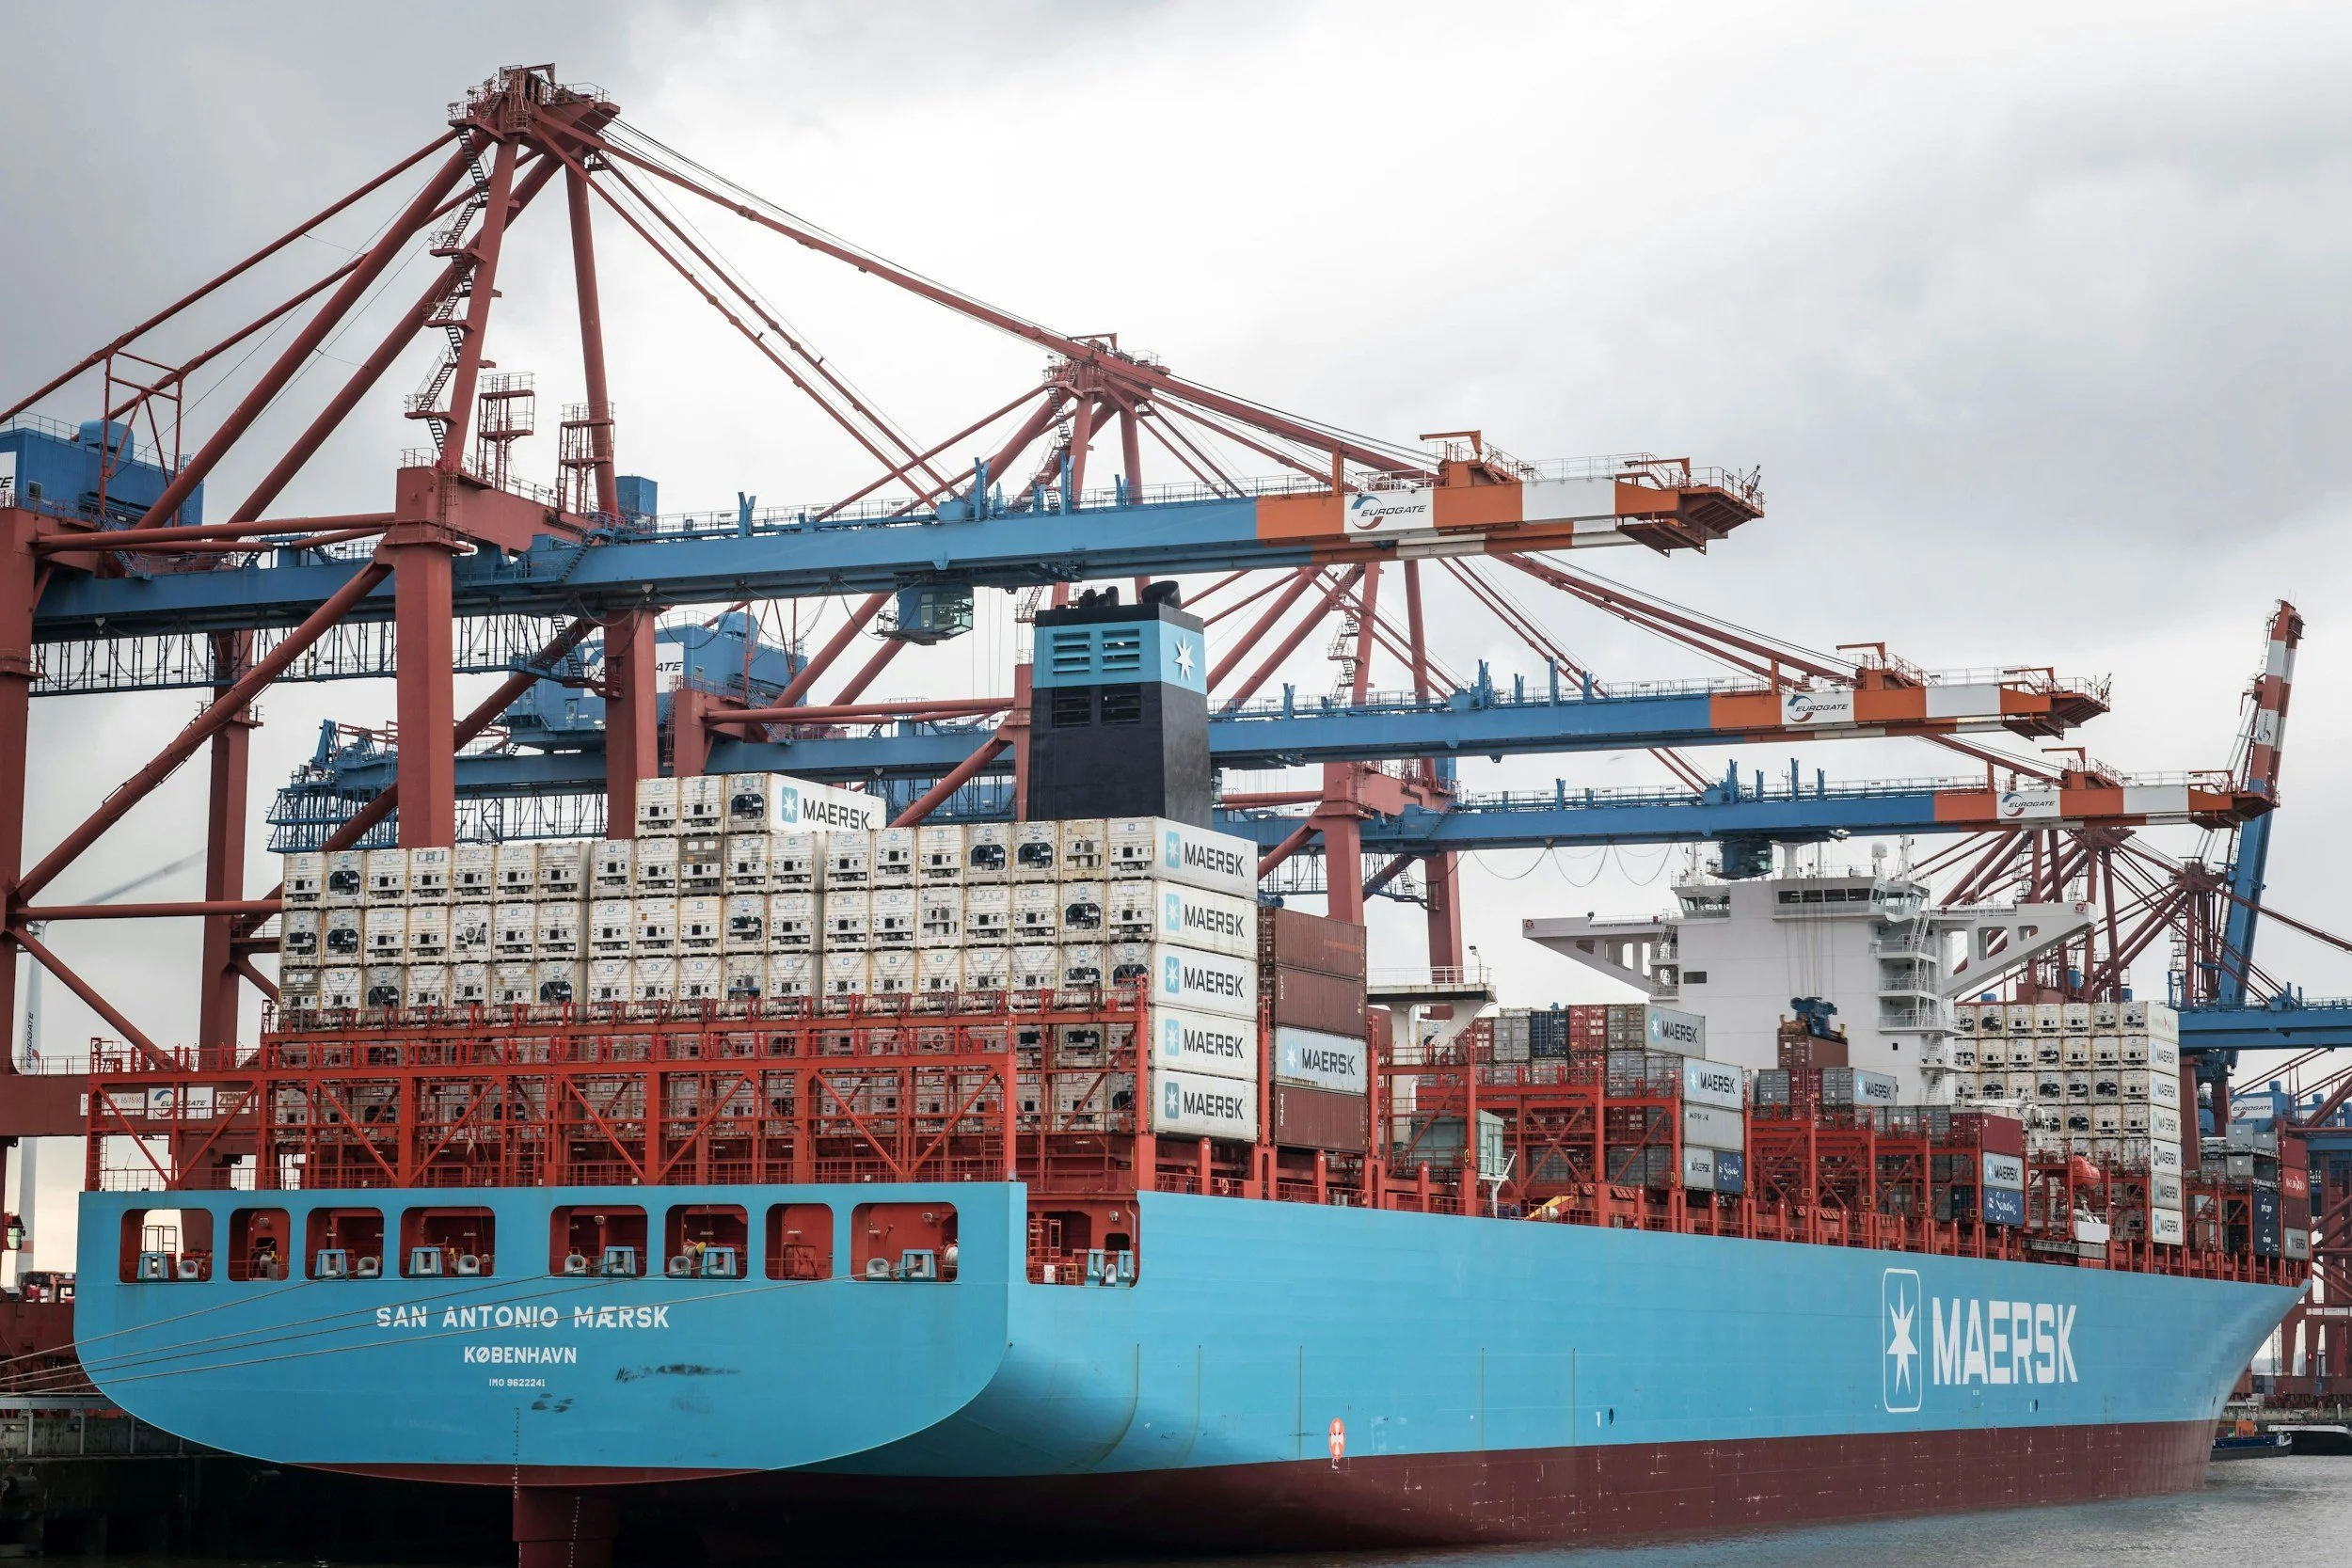
Operational monitoring
The Port Congestion Index (PCI) tracks vessel accumulation at major ports using radar satellite imagery. Updated weekly, it offers an experimental satellite-based perspective on global trade congestion.
Latest explorations from the Lab
Have an idea or feedback? Get in touch.
Sign up to follow