Expansion of Riyadh 2015-2025 seen with Sentinel-1 SAR
This post is part of the “Measuring from Orbit“ series, where we turn satellite data into measurable signals of how the world is changing.
Riyadh, the beating heart of the Arabian peninsula, has stood for over a thousand years though was called Hajr half that time.
In the 1960s urbanisation accelerated in Riyadh like in the rest of the world. The population of Riyadh was then around 160,000. Today, 8 million. That kind of growth must be visible from space.
Unfortunately, there are no satellite images from 1960s. Well I’ll be damned, there are declassified satellite images from 1966 in the US Geological Survey archives. That 60-year old image below is 1.7gb in size and considerably sharper (30cm resolution) than the free Sentinel 2 imagery I have access to today.
Riyadh 1966. Image © USGS
For comparison, below is today’s mosaic with the 1966 image area marked (the 9km measures the horisontal distance).
Riyadh today - The 9km wide area of the 1966 photo marked.
Today’s Exploration
Today we build a SAR-driven script highlighting Riyadh’s expansion directions. We only look to the last 10 years, during which the city added well over a million new residents.
This would have been an easy Exploration if towards the end I hadn’t revisited the script to perfect it. But more about that struggle in paragraph 5.
1. Deciding on a custom approach instead of Copernicus Browser
Copernicus browser’s default Sentinel-1 SAR Urban mosaics provide an excellent view to cities, thanks the author Monja B. Šebela who offered a brilliant way to colour building reflection returns differently based on VV/VH polarisation. It makes the resulting image lively and better resembles city fabric.
But to be able to calculate differences and create specific change layers, I did an analysis on Google Earth Editor while mimicking Šebela’s colouring approach.
By now, I understand much of the logic, architecture and ways to configure the code blocks, but I’m not a programmer and rely heavily on AI and build the script block by block. If it works out the box and the results make sense, I don’t ask too many questions and move on. Often, it doesn’t work on the first try and that’s where I need to jump in, dissect and understand how to tweak and make the code work from a logical perspective.
2. Building the image mosaics comparison in GEE
The first step was easy enough: Building two mosaics with scenes from 2015 and 2025. The process filters out scenes that don’t match my AOI over Riyadh or don’t have scenes containing both VV & VH returns.
VV & VH are different polarisations. The Vertical-Vertical captures clean returns from surface textures and their structure (such as roads and flat roofs), where the Vertical-Horizontal is better at capturing volume and geometry, especially built-up zones and vegetation.
The final collection used a mean of just 4 scenes in 2015 and a mosaic of 3 months in 2025. I tried to lock orbits for a cleaner before-after comparison but saw little practical impact. I also tried a few elevation/slope filters but meaningful improvement in results would have taken more time.
The second step was colouring the mosaics. For this, it was necessary to convert the default SAR dB returns into linear values, so that we could employ Monja’s thresholds for RGB colouring. Below are the results (move the slider to compare).
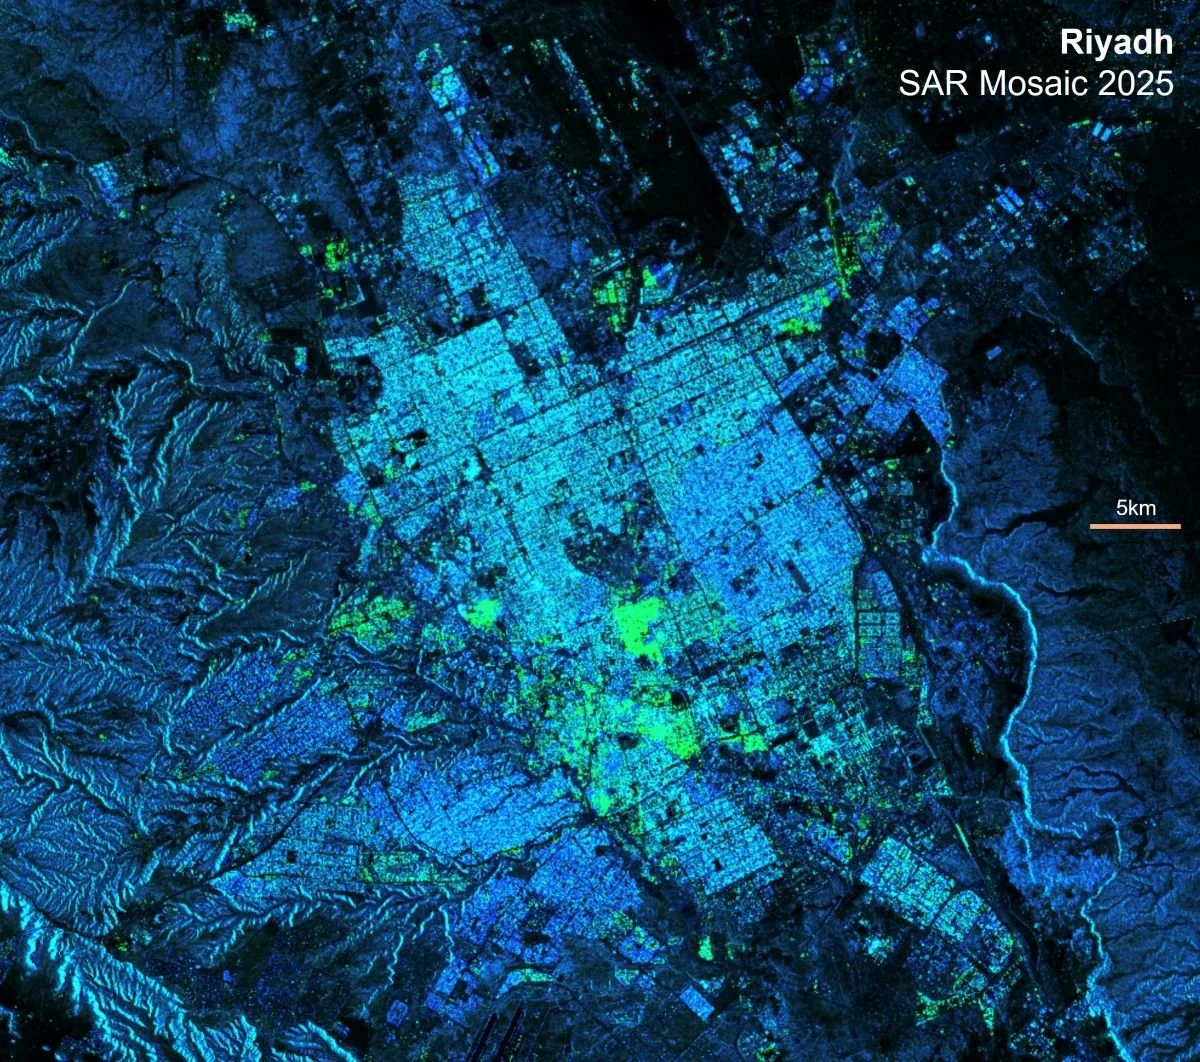
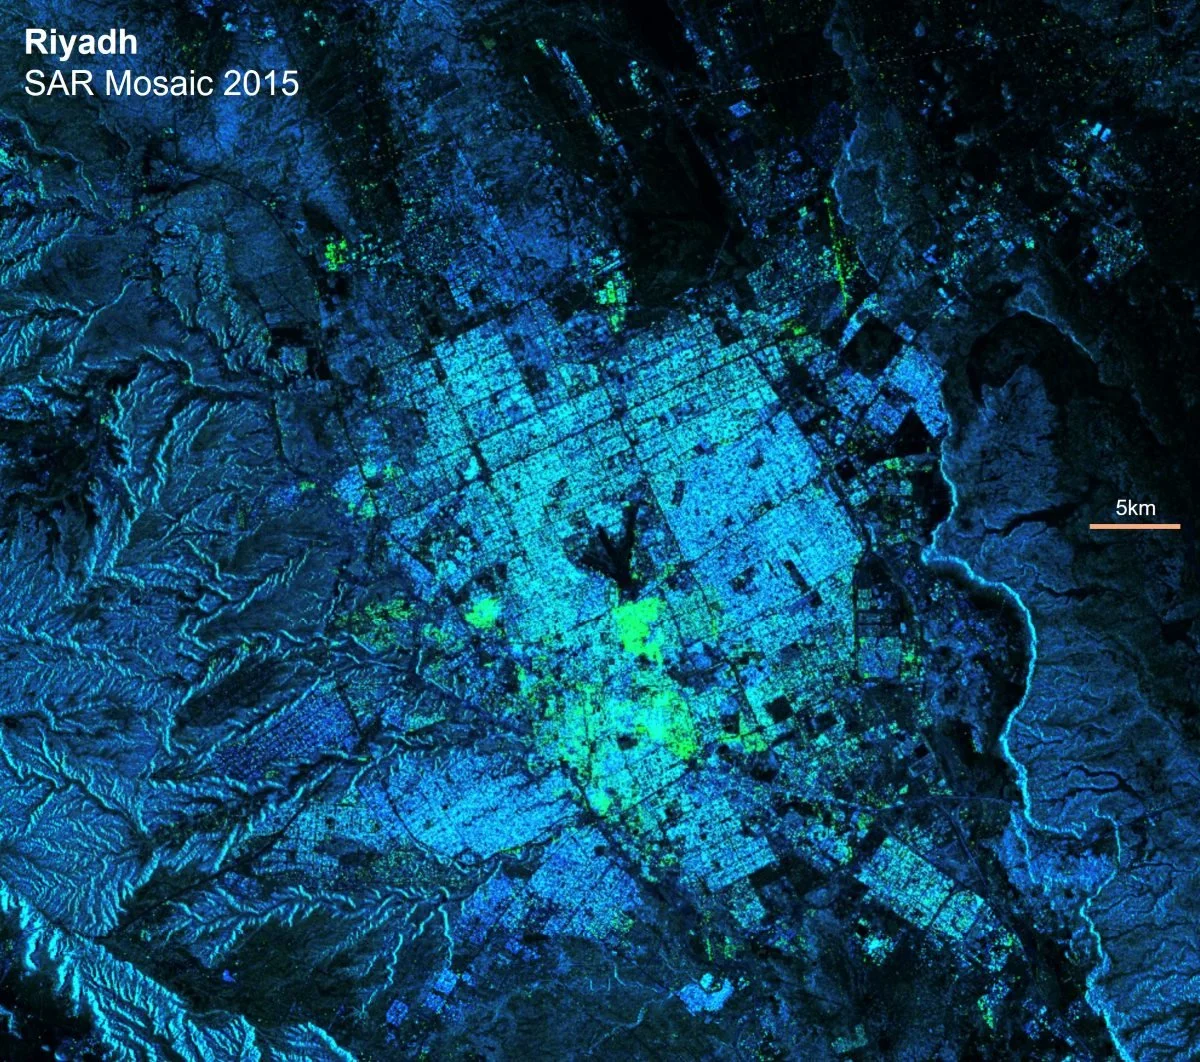
Riyadh SAR Urban 2015-2025. Colouring mimicking a script by Monja B. Šebela.
3. Analysing the change between 2015-2025
The mosaics already allow visual comparison, but a visual mask makes it explicit. The resulting mask is:
Red marking high-confidence new built area
Blue marking high confidence emptied/demolished areas. Black is unchanged
© Map Data: Google
The comparison illustrates where the city has expanded or went through large scale redevelopment. This works well in a case like Riyadh that expands outwards to non-built areas.
Result: The calculated net change is ~56 square kilometres, which is conservative. We could at least double or triple it it for a floor area approximation as our SAR only detects the roofs of buildings, not floors or land areas classified as urban.
Is that number a lot? Yes. If we consider the population growth of over million people (also a lot) in the same ten years, it is a ballpark of 100 square meters per new resident. We could further split the building stock into offices, logistics etc. but that would get awfully close to my day to day work so I’ll stop that train of thought.
To flag the expansion directions:
Southwest corridor toward Qiddiyah, with the newer Al Mahdiyah villa-led residential area. If the image stretched further west, it would show Qiddiyah in a wadi-system surrounded by the Tuwaiq escarpment
West side of King Khalid International airport, a major growth direction including the Expo 2030 area Khuzam Destination
Northeast expansion, with project-led residential developments like Al Fursan
Khashm Al Alan; A growing military base with its residential component development visible, but the overall eastern expansion direction more constrained by steeper terrain
Southern growth toward the old King Salman Air Base, undergoing conversion into a modern urban district
A key remaining challenge both for the visual inspection and the calculation is the “random”, smaller blue/red noise in the city centre, that is mostly false detections around existing structures and also in the unbuilt desert areas. I could have lived with it, but then went to look at Shenzhen.
4. Taking the script to Shenzhen
I wanted to see how the script functions in another city and focused on Shenzhen - China for two reasons: Its high-profile growth story shares similarities with Riyadh’s and Saudi Arabia’s transformation. But from an urban standpoint it looks very different. Riyadh grew outwards, Shenzhen has seen large scale re-development and urban intensification inside an existing city fabric.
The script worked: Below is an example of the major Baouin bay development with the change mask and satellite image for comparison.
Baouin Bay development in Shenzhen.
However, we can also see a large mess of blue & red filaments in the right hand-side of the image and not be certain if it’s development or not. They’re not random speckle, but actually existing buildings returning slightly different, but strong, radar signals across acquisitions. The change detection logic declares “this changed”. I started getting annoyed by it the more I looked at different areas of Shenzhen.
See below an examples:
A: At first, this looked like a false negative, but satellite image reveals the forest has indeed been cleared for a park
B: This (and most other filaments) are an existing building falsely detected as change
5. Failing to clean the image (without breaking the bank)
Getting here was quick and in hindsight, this is where things started going downhill. I moved well over to the definition of insanity: Doing the same thing repeatedly and expecting different results.
Cleaning the filaments was easier said than done. I searched for approaches and tried four different operations: Temporal stability masks. Morphological cleaning. Ascending/descending fusion. Light speckle filtering.
Some of the approaches simply didn’t produce a different result. The one where I focused on size threshold worked well, but was way too heavy to run over an entire city and I can’t spend too much cash on producing a few images. Ultimately, I wasted too many EECU credits with not much to show.
Cleaning building filaments is not a “one clever trick” problem. It sits somewhere between:
Advanced SAR signal processing
Professional-grade tooling
More research time than a one-hour experiment
More processing budget than I want to spend
Or simply higher spatial resolution data
Possibly all the above. The real mistake here was expecting to solve it in two hours. For now, the filaments stay and don’t take much away from the original goal: Detect urban expansion in Riyadh. With more time, I would figure it out.
Conclusion
Highlighting urban change with SAR and calculating the changes were easy enough. Trying to do it perfectly with my skills was banging one’s head against the wall without making a large dent. Now I only wish I’ll make it to Riyadh or Shenzhen to see these evolving cities with my own eyes.
See you,
Orbital Vantage