Using SAR to understand flooding in Wadi Rum and Bangladesh
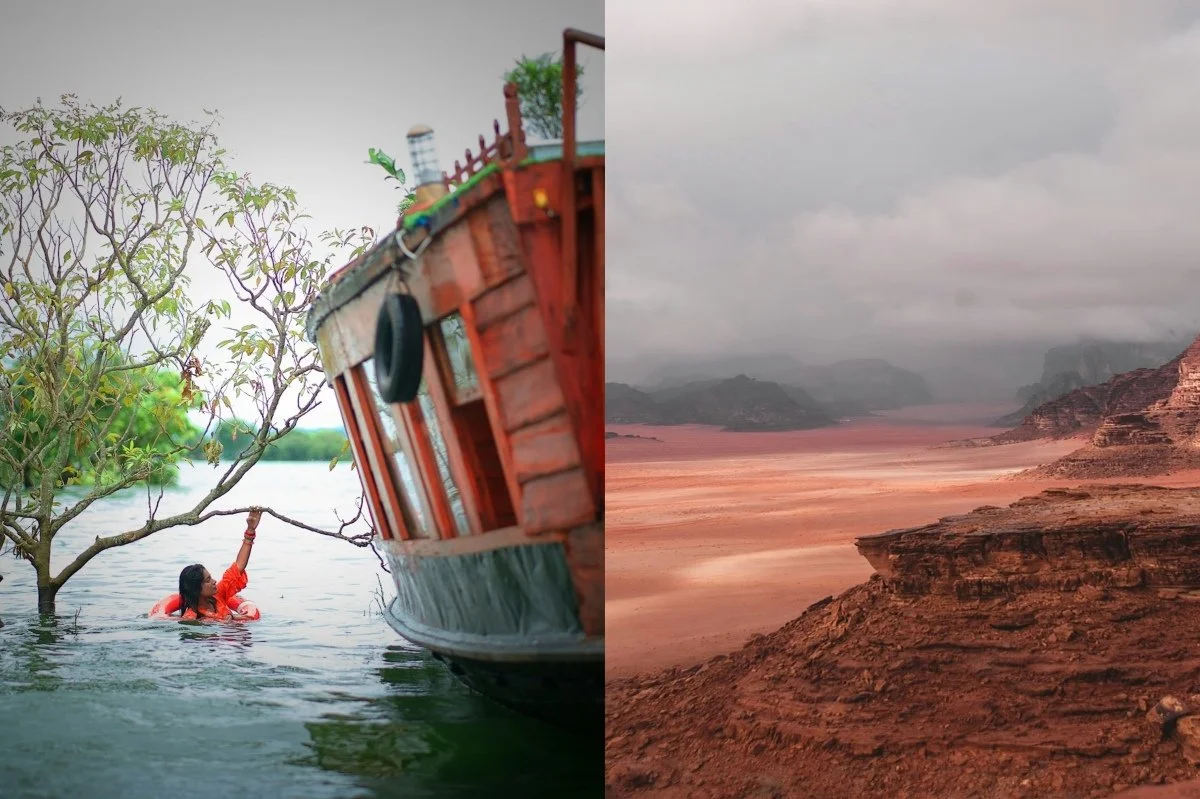
Bangladesh flood (Photo by Nazmul Ahsan Meraz) & Wadi Rum rainy weather (Photo by Olga Angelucci)
If I had known in advance how much I must learn and bang my head against the wall to get results, I probably wouldn’t have done this post.
A month before running on sea ice, I hiked 90km in Wadi Rum Desert in Jordan. It is bone dry, except in the occasional rain when flash floods become a real risk. There were no flood risk maps published for Wadi Rum. Could satellites help me understand the flood risk?
In this post, I walk through my attempts and learnings to use SAR (Synthetic Aperture Radar) to understand flood risk in the desert, failing in that, and then pivoting to Bangladesh’s 2020 floods to build something that actually works.
1. The SAR Premise: See through clouds and at night
It rained a lot mid-December in Wadi Rum and Petra so initially I thought this is going to be easy: Let’s just look at satellite photos of water flows and accumulation areas. It turns out that when it rains, there are clouds. They are poison to optical-based satellite images.
I turned to SAR or Synthetic Aperture Radar. It uses radar reflectivity to see ground through clouds and at night. This is why it’s the hottest Earth Observation tech with wide-ranging applications. The Finnish company ICEYE being the first to develop and launch a commercial SAR-satellite in 2018.
In basic terms, SAR waves travel through clouds and bounce back when they hit something solid. The bounce (reflection) changes with different ground textures, materials and shapes which can then be interpreted.
The mechanism to study changes in ground is a simple Before-After analysis: Establish a baseline to see what a normal SAR view looks like (in my case the dry desert) and then compare it to an after-event view when something should be different (wet). The differences between the views tell the story. I’m using GEE (Google Earth Engine) to do this.
2. Lesson: A desert is a difficult place to find water
With satellites, I only have access to free imagery and there were 3 days between Wadi Rum’s mid-December rainfall event and available post-event satellite scenes. That 2-3 difference is an eternity for water in the desert. The water pools quickly, but after rain stops it quickly filters into the sandy ground and evaporates, even within a couple of hours. Whatever moisture is left under top-soil, or how water flows have changed the sand surface, can in theory be detected in minimal changes in radar reflectivity within a day or two.
A camel would have died of thirst during the time I tried to configure the comparison shots to show any changes in radar reflectivity. Alas, my amateur configuration skills were unable to find any meaningful before-after differences even with the help of AI. Furthermore, I learnt the sharp geometry of Wadi Rum with reflective high cliffs and narrow canyons distort and limits the satellites’ view.
After my AI-programming support promised me the fifth time “Here is the final configuration fix (the one that works)”, I decided to leave SAR-driven moisture identification in desert to the pros and move onto wetter grounds to see what I can find.
Conclusion: Leave desert moisture tracking to the pros. If needed in future, build a flood risk map for Wadi Rum with simple elevation profile data (SRTM) the traditional way.
3. Creating a simple SAR architecture to track flood extent in Bangladesh
“Let’s just find a place where the flood water stays on the ground for days, that must guarantee results.”
Wrong. Bangladesh is a wet place and tragically so, threatened both by intensifying monsoon, seawater rise and typhoons. Compared to Wadi Rum it is the other extreme.
I focused my analysis on the catastrophic July floods of 2020 that left half the country under water. Below is visual satellite image of the final study area near Sirajgonj in late July 2020. As you can see, the clouds effectively block the view to the ground.
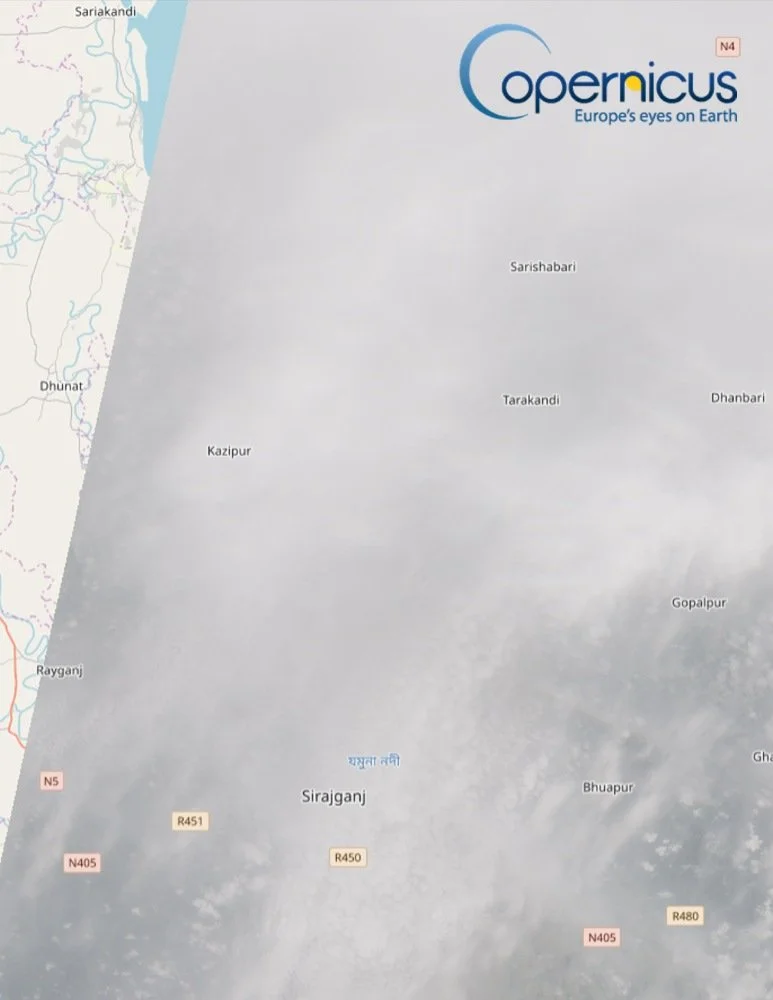
Target study area in Bangladesh under cloud in July 2020
I first tried the same approach I had built for the desert but disappointingly saw no meaningful SAR changes. I knew for a fact there was water I should be seeing. I had to go back to the drawing board.
Scratching my head, I realized the fine-combing desert approach doesn’t work in places that are constantly wet like Bangladesh. I employed the support of AI to build a simple analysis flow for GEE (Google Earth Engine) block-by-block:
A. Establish a baseline pre-flood view
B. Establish a flood-event view
C. Find the difference
D. Create a visual water mask
E. Check the result
A. Establish a proper baseline
This was simple. February-March in Bangladesh are dryer and there were a lot of available SAR scenes. Using just one scene could be problematic, because there is random speckle, backscatter and sampling issues that would distort the view. The key is to use a median of multiple images, which eliminates the noise but leaves visible what is really on the ground.
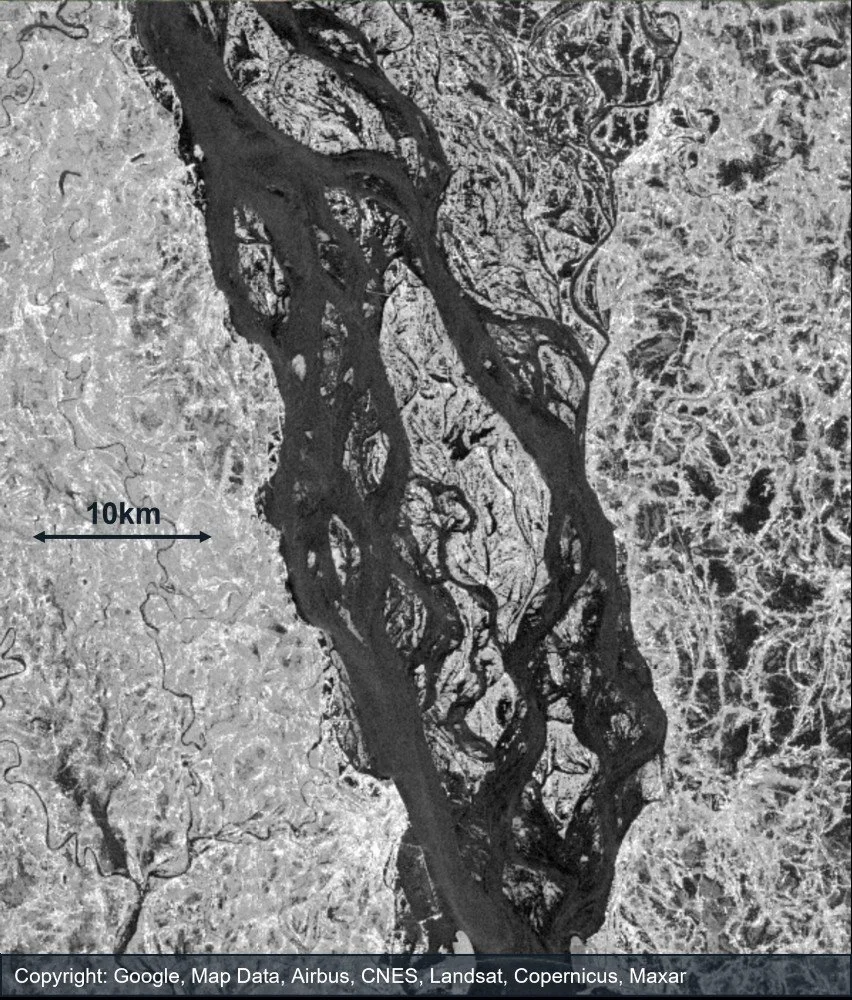
With 8 available scenes, GEE generated me the “before flood” view that looks like below. One can see the Brahmaputra river and year-round waterbodies in dark. Everything white or lighter shades are land. I also looked at a normal satellite map below to sanity check the baseline image.
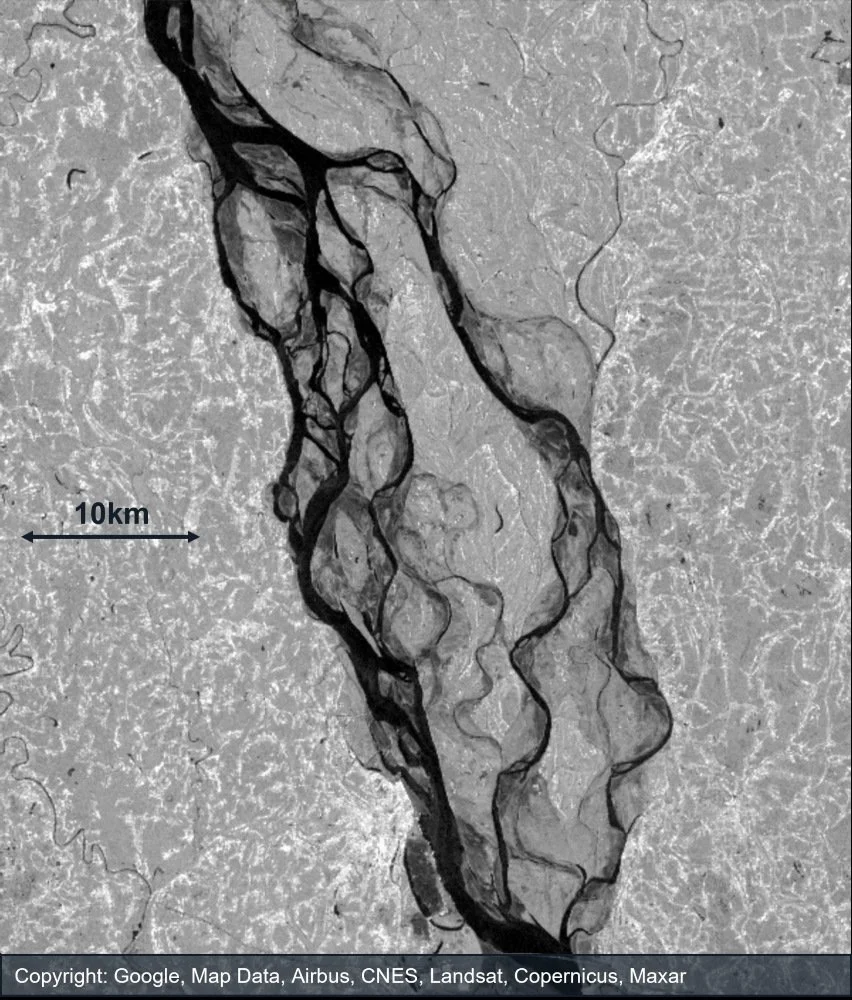
The baseline image of normal conditions in February-March 2020 showing the river.
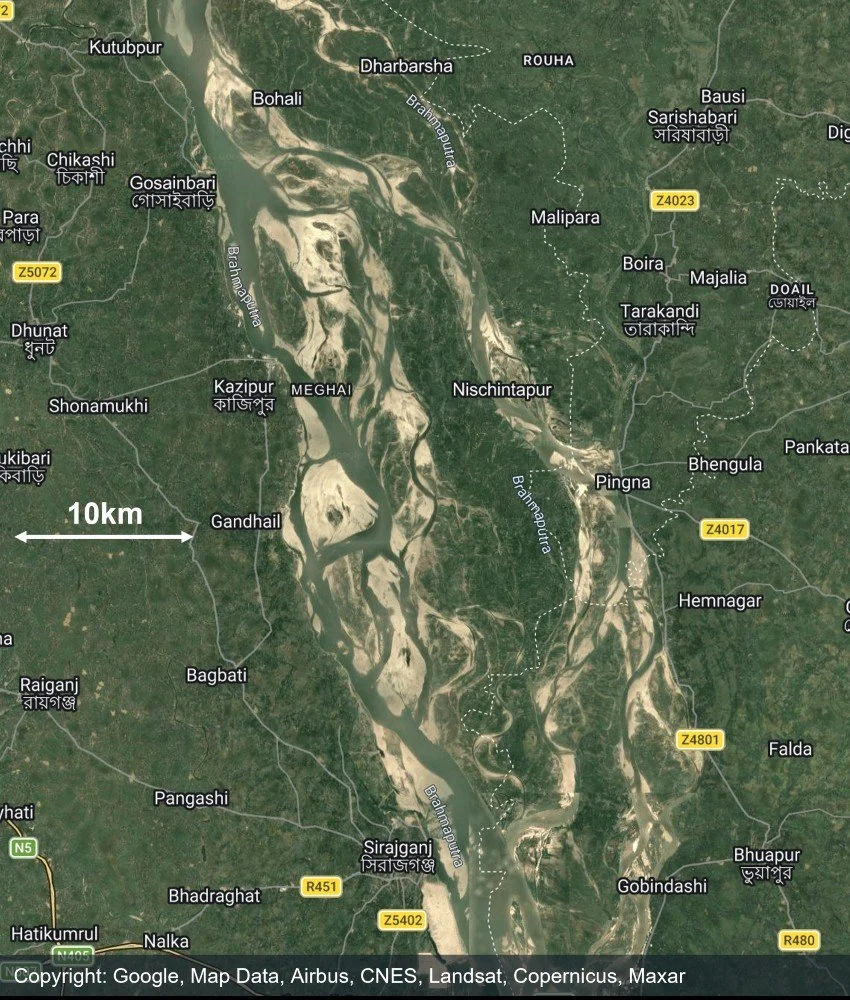
A sanity check comparison with Sentinel 2 mosaic to confirm the baseline looks correct.
B. Establish a flood-event view
This step forced me to change my study area AOI (Area of Interest) a few times due to lack of suitable SAR satellite views during the flood. When I found a location with a good number of July scenes (5) I got a result quite easily, though in hindsight one event image might have done trick well enough too. See below: Now we see a lot of new and wider black areas around the river, indicating a flooded river. This image could be used by itself, but it is more useful to highlight just the flooded areas so we are moving on.
The flood event view shows in dark all areas under water.
C. Find the difference
This is basically a deduction: Deduct the radar reflectivity per pixel before and after and see what is different. Fine-tune and configure to optimize what is accepted as a difference. I had help from AI to build this configuration and only adjusted the sensitivity threshold of water myself.
D. Create a visual mask
Now it was only a matter of visualizing the result in colour. Below is the result that I’m quite happy with for a first timer. The blue areas show flooded areas around the river and beyond. The black areas show the normal footprint of the river. There were entire residential areas and agricultural land under complete water for days. Some areas of Bangladesh were over 50% submerged.
The patchy colouring may indicate that some of the water has already receded in this analysis. The analysis on my script showed ~21% flood coverage (this doesn’t include normal water bodies). Use of tighter event window close to the flood peak might show more extensive blanket flooding.
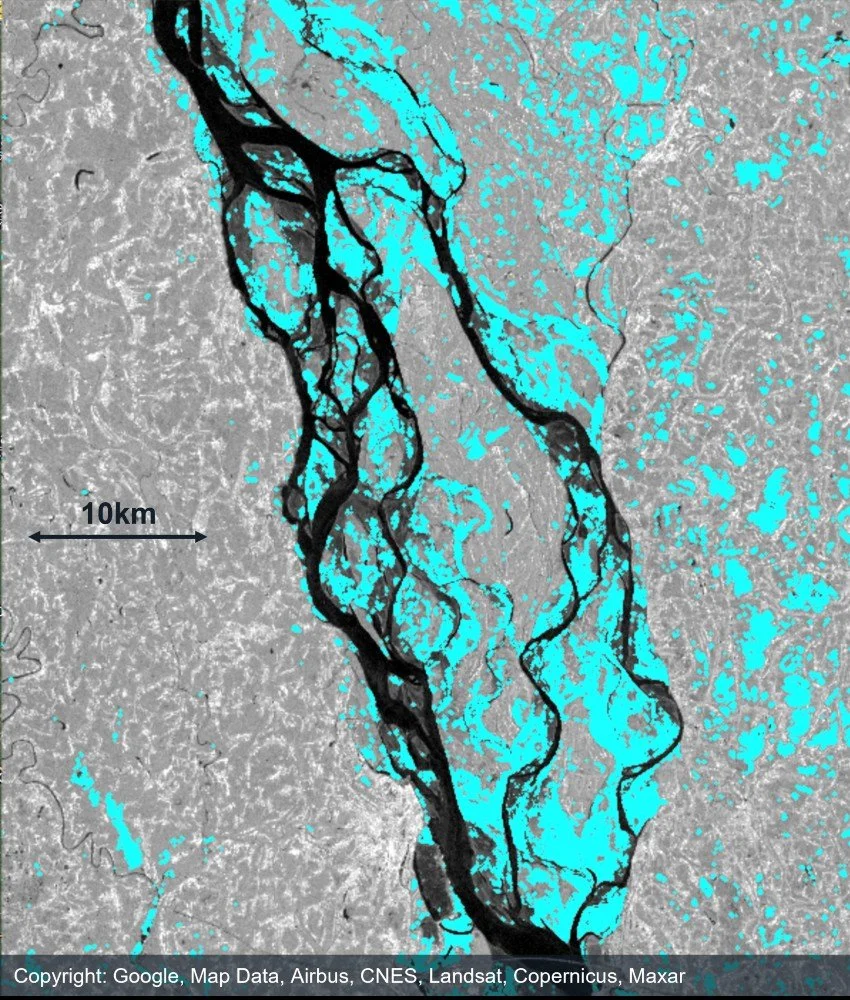
Visual mask highlighting flooded areas.
Closer view around Arjuna.
Closer view of Malipar shows road access mostly cut with large swaths still under water.
These images don’t show the peak flood levels I believe, but they do help us demonstrate the power of SAR in cloudy conditions for flood extent analysis.
4. Conclusion
SAR is powerful because it helps understand structural changes on the ground regardless of weather or time of day, but only if one respects the local context and timescales to be able to detect reflectivity changes. The analysis is more complicated than just looking at a photo, but more reliable and helpful. I learnt a lot by doing this exercise.
In future, I can modify and use the same analysis architecture to study other flood areas, like potential spring-time floods in Pohjanmaa 2026 or across Europe.
See you,
Orbital Vantage