Watching the Sun, measuring the Earth: January 2026 geostorm
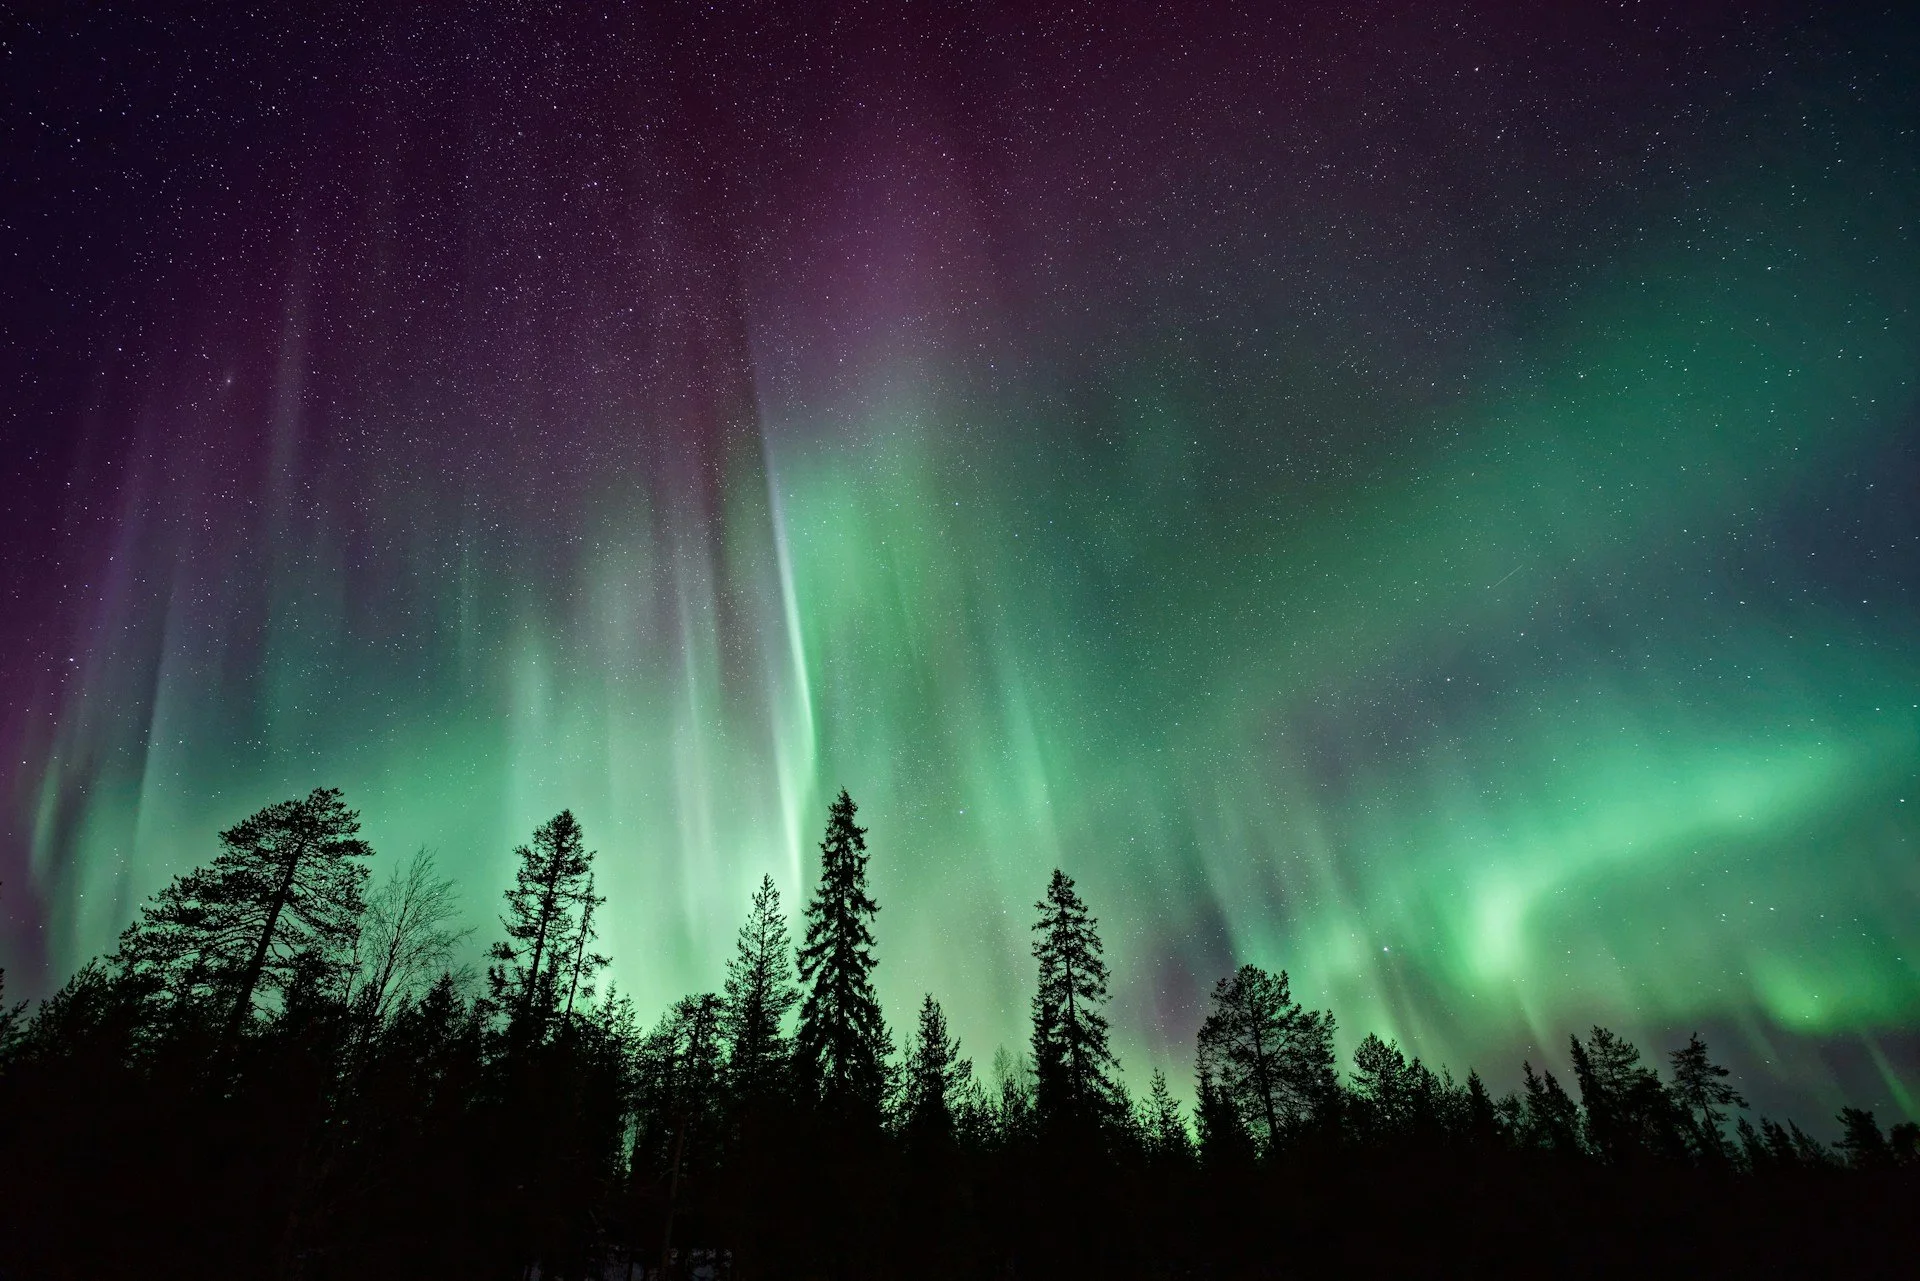
Aurora Borealis. Photo by Vincent Goth
I’ve always had a keen interest in space. Long before my professional life dragged me into business I spent time marveling at Hubble imagery and reading about things like Chandrasekhar’s limit.
While the core of Orbital Vantage is on Earth, today we take a look beyond. On January 18th, 2026 the Sun flashed with an X-class solar flare. 25 hours later it created the most powerful solar storm to hit Earth since 1989. Skies as far south as Spain were lit with Auroras, but we were spared more disruptive effects.
How did the flare and Sun look like and what was measured on Earth?
1. Appreciating the solar flare
The Solar Dynamics Observatory by NASA was launched in 2010 with an expected lifespan of 5 years. It is still going strong. It is locked above earth in a geosynchronous orbit and kept pointing towards the sun producing brilliant imagery.
Solar flares tend to happen near sunspots that are darker-looking areas and associated with powerful magnetic anomalies. The release of this pent-up magnetic energy results in solar flares.
The video below shows a 7 second loop of the Earth-facing part of the Sun on January 18th. You can see the flash starting at the 5s mark. That is the solar flare officially clocked to occur at 18:09 UTC. You can see the flash start forming already an hour before and the post-release effects linger to the end of the day.
It doesn’t look like much to non-experts, not even a sneeze. More like cough. But the area that flashes is roughly a thousand times the size of Earth and the amount of energy released is comparable to billion hydrogen bombs. A side-view would show the flare-up better.
Solar flares cause the flash, coronal mass ejections cause the auroras. They are separate but often connected. The light from the flare reaches Earth in 8 minutes, but the mass of charged particles traveled in this case for 25 hours to reach Earth. This was a reasonably long warning time but the full intensity is not really known before the solar wind starts hitting Earth’s magnetosphere.
2. The Sun didn’t notice what the fuss is about
The energy comparable to billion hydrogen bombs made me expect photoworthy before-after analysis: A difference in the corona, lighter or darker area near the flash, clear changes in the magnetic field. I looked at three days before and after the flare. Alas, I found nothing; It’s indeed like the Sun just coughed without missing a beat, which altogether isn’t too surprising considering the scale of the operation.
Looking at images below from the day of the solar flare, however, one can appreciate the complexity of the Sun’s surface and how they relate to the flare.
Sun spots with visible light (HMIIC)
This photo shows sunspots and is what one would see looking at the Sun through an optical sun filter. The solar flare originated at the largest spot on centre left.
SDO HMIIC on January 18th 2026
Magnetic tension with magnetogram (HMIIB)
This magnetogram view shows us the magnetic anomalies around sunspots. The more intense the red-blue colour variations the stronger the magnetic tension.
SDO HMIIB on January 18th 2026
Magnetic field lines with extreme ultraviolet spectrum (171)
This is an Extreme Ultraviolet spectrum and highlights the magnetic field lines and coronal loops with the plasma traces.
SDO 171 on January 18th 2026
Coronal hole with extreme ultraviolet spectrum (193)
This Extreme Ultraviolet image brings out the corona. The black area is a “coronal hole”, which looks dramatic but in practice is just a somewhat cooler area of the corona.
SDO 193 on January 18th 2026
While the above images are impressive, I struggle to write a blog that’s just pretty so we need to move on and get our hands on some meaningful before-after data.
3. The Earth was fussing
When the Sun coughs, Earth needs a protective magnetic facemask. Changes in Earth’s magnetic field are measured every three hours and disturbances are rated on a logarithmic Planetary K-Index (Kp Solar Index) ranging from 0 to 9. GFZ Helmholtz Centre for GeoSciences for one tracks and publishes this data.
I downloaded the data around the Jan 19th event and put it in a graph below. The Kp spikes to 8.7, almost to the top of the scale appx. 25 hours after the flare, and then stays up for multiple days with slightly lesser intensity. This tells us two things: 1. The storm was right there among the strongest recorded storms, and 2. The coronal mass ejection is not just a single shockwave but a longer stream of ejected matter.
To put the above into context, below is GFZ’s graph of recorded data, roughly showing a running yearly mean of 2.7-3.0. As you can see, the last 26 years have been quiet on the solar front, but throughout history there is steady occurrence of the occasional 9-peaking events. NASA says solar activity is again ramping up.
Conclusion: More than Auroras
My original interest in space was mostly about science and beauty: Brilliant imagery and clear data, just like in this post. But looking at a near-scale-9 geomagnetic storm also makes me think about the wider disruptive potential.
The January 19th event didn’t cause major disruptions. So far we have been lucky to not have been hit with the even-more powerful ones: They have happened before our society was hyper-dependent on electricity like the Carrington event in 1859, or missed us by a close margin like in 2012.
Despite all the data and observation, there is no way to predict the next one.
See you,
Orbital Vantage